
The Overlooked CPU Bottleneck in GPU-Based Distributed Processing — and How taskset Solves It


Hello!
When designing parallel processing systems that use multiple GPUs, it is easy to design the whole system without giving much thought to the CPU.
"The GPU is the star of a machine learning system, so surely the CPU doesn't need much attention?"
Actually, that is not quite true.
When things suddenly slow down at certain moments during inference, the CPU is quite often the culprit.
Overview (the key points in 5 minutes)
Recently, in a parallel processing system built on GPUs, we ran into an unexpected CPU bottleneck that dragged performance down significantly.
Even though multiple processes were using different GPUs, processing became extremely slow. The cause turned out to be CPU-intensive computation hidden inside part of the processing pipeline.
Symptoms
- Single process: normal speed
- Multiple processes in parallel: processing time increases severalfold
- No GPU resource contention (confirmed with nvidia-smi)
Root cause
The processing pipeline contained CPU-intensive computation (data preprocessing, statistical transformations, and so on) that was not suited to the GPU. With multiple processes fighting over the same CPU cores, cache contention and context switches ran rampant.
Solution
taskset command pins each process to specific CPU cores
→ This prevents multiple processes from fighting over the same CPU cores
You would think the OS should just handle this gracefully, but
in our case, multiple processes were all trying to use the very first CPU core
This is exactly the kind of thing you have to control explicitly.
# Pin process 1 to CPUs 0-7
taskset -c 0-7 python process1.py --gpu 0

# Pin process 2 to CPUs 8-15
taskset -c 8-15 python process2.py --gpu 1
Points to keep in mind
- Intel Core series: account for P/E core characteristics and place CPU-intensive tasks on P-cores
- Intel Xeon series: account for the NUMA architecture and allocate cores within the same socket
- Reserve cores for system processes: do not occupy every core — leave 1-2 cores free
With just this simple setting, performance under parallel execution improved dramatically, and we achieved near-ideal parallelization efficiency.
An egg-of-Columbus solution — obvious only in hindsight.
That wraps up the quick version.
Below, the detailed edition continues with how we pinpointed the cause, the underlying mechanism, and how to configure things for different CPU characteristics
The Detailed Version: Technical Background and Implementation
So, that was the overview.
From here, we dig into the details of the problem and the concrete implementation.
The Problem and Identifying the Cause
Discovery and initial confusion
One day, we observed a strange phenomenon in a multi-GPU processing system our team was developing.
The system was designed to run parallel processing over large datasets and ran on a server equipped with multiple GPUs. For simplicity, we will describe it here as a two-GPU setup.
With a single process, everything ran at the expected speed and GPU utilization stayed at healthy levels. But when we assigned two processes to different GPUs (CUDA:0 and CUDA:1) and ran them simultaneously, certain processing steps slowed down drastically. Work that finished in a few seconds when run alone started taking tens of seconds — sometimes minutes — when run in parallel.
At first, the team suspected GPU resource contention. Monitoring the GPUs with the nvidia-smi command, however, confirmed that each process was definitely using a different GPU and that GPU memory usage was well within acceptable limits.
Pinpointing the cause
Once GPU resources were ruled out, we began a detailed analysis of the entire processing pipeline.
We measured the execution time of each processing step and brought in profiling tools to locate the bottleneck.
After several days of investigation, we found that part of the processing pipeline contained CPU-intensive computation.
This step accounted for only a few percent of the total processing time, but a closer look revealed it to be the statistical transformation work required during data preprocessing, involving heavy matrix operations. Specifically: input normalization, feature extraction, and complex mathematical transformations. These operations were sequential in nature and hard to parallelize, so they had been written for the CPU rather than the GPU.
Something was clearly happening on the CPU side, so we dug further into the problem to find its root cause.
The Root Cause: CPU Resource Contention
Tracing the root cause, we eventually discovered that it was CPU resource contention. The rest of this article explains what that means.
Understanding CPU architecture and core counts
To understand the problem deeply, we first need to look at the architecture and core layout of the CPU in use.
Typical core configurations in the Intel Core series
| Generation | Model | Total cores | Total threads | P-cores | P-core threads | E-cores | E-core threads |
|---|---|---|---|---|---|---|---|
| 12th Gen | Core i9-12900K | 16 | 24 | 8 | 16 | 8 | 8 |
| 13th Gen | Core i9-13900K | 24 | 32 | 8 | 16 | 16 | 16 |
| 14th Gen | Core i9-14900K | 24 | 32 | 8 | 16 | 16 | 16 |
From the 12th generation onward, the Intel Core series adopts a hybrid layout of high-performance P-cores (Performance-cores) and power-efficient E-cores (Efficiency-cores). With this layout, it is important to assign CPU-intensive tasks to the P-cores.
Characteristics of the Intel Xeon series
| Series | Model | Cores | Threads | Notes |
|---|---|---|---|---|
| Xeon Gold | 6354 | 18 | 36 | |
| Xeon Gold | 6348 | 28 | 56 | |
| Xeon Platinum | 8380 | 40 | 80 | |
| Xeon Platinum | 8480+ | 56 | 112 | Supports up to 2 sockets |
The defining feature of the Xeon series is its support for multi-socket configurations.
For example, the Xeon Platinum 8480+ supports up to a 2-socket configuration, delivering a combined 112 cores and 224 threads of compute power
How the Problem Arises
Let us look closely at how CPU resource contention occurs and why it causes such a severe performance drop.
Before applying taskset
Running multiple CPU-intensive processes simultaneously produces a situation like this
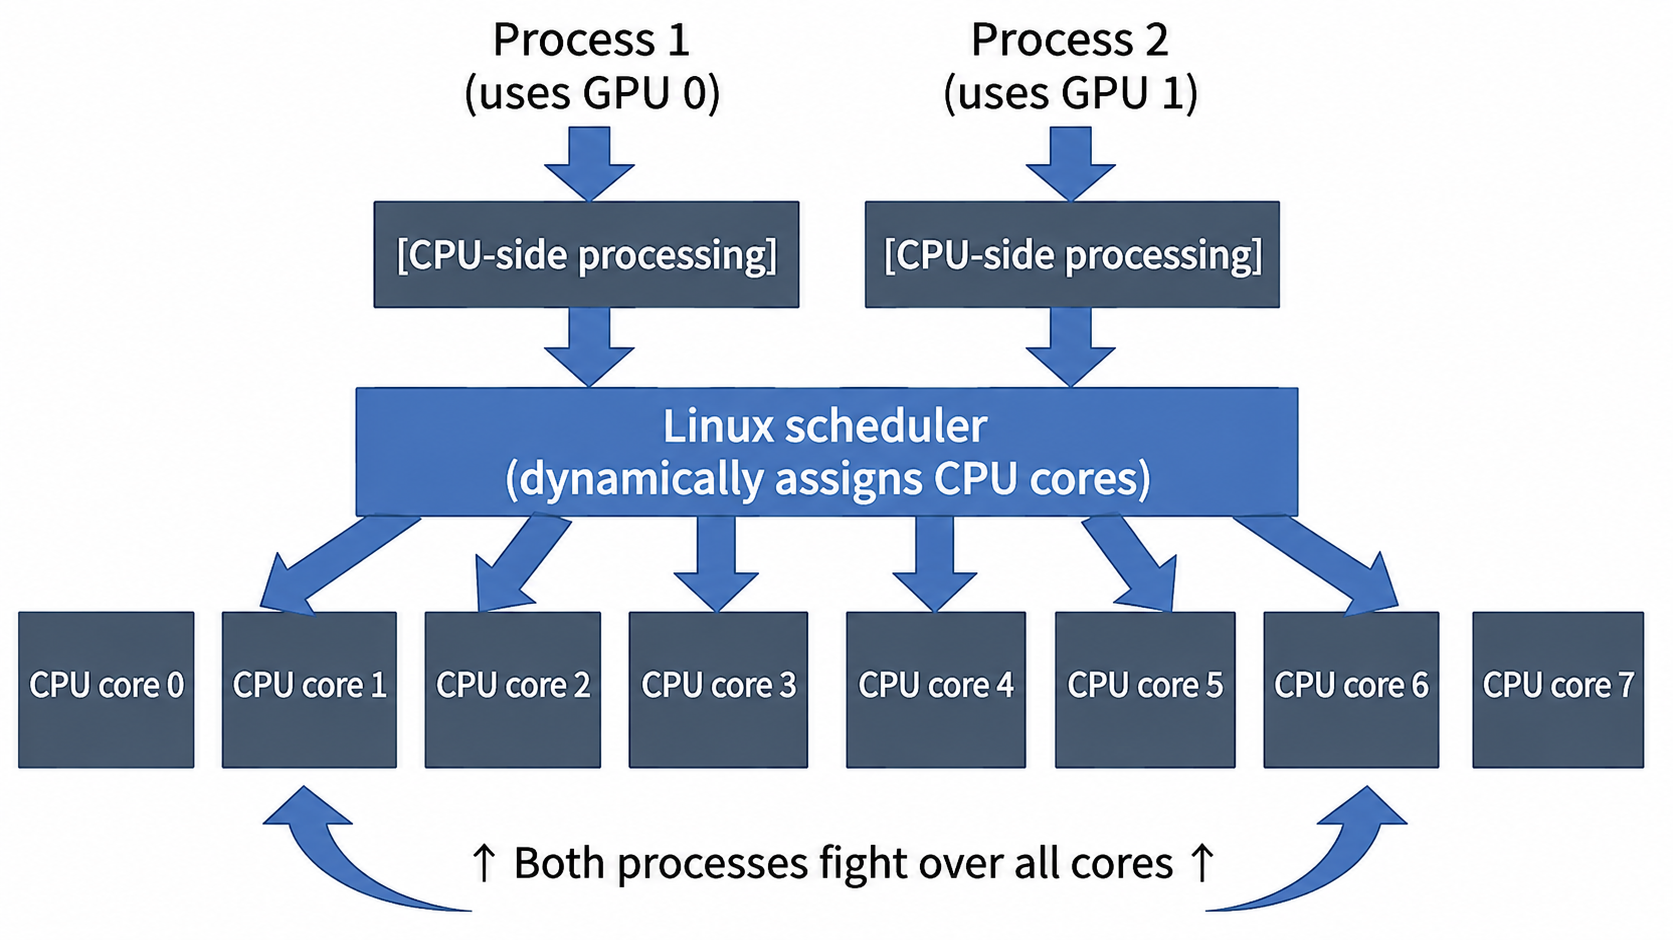
Viewed along the time axis, what is actually happening is a fierce tug-of-war over CPU cores
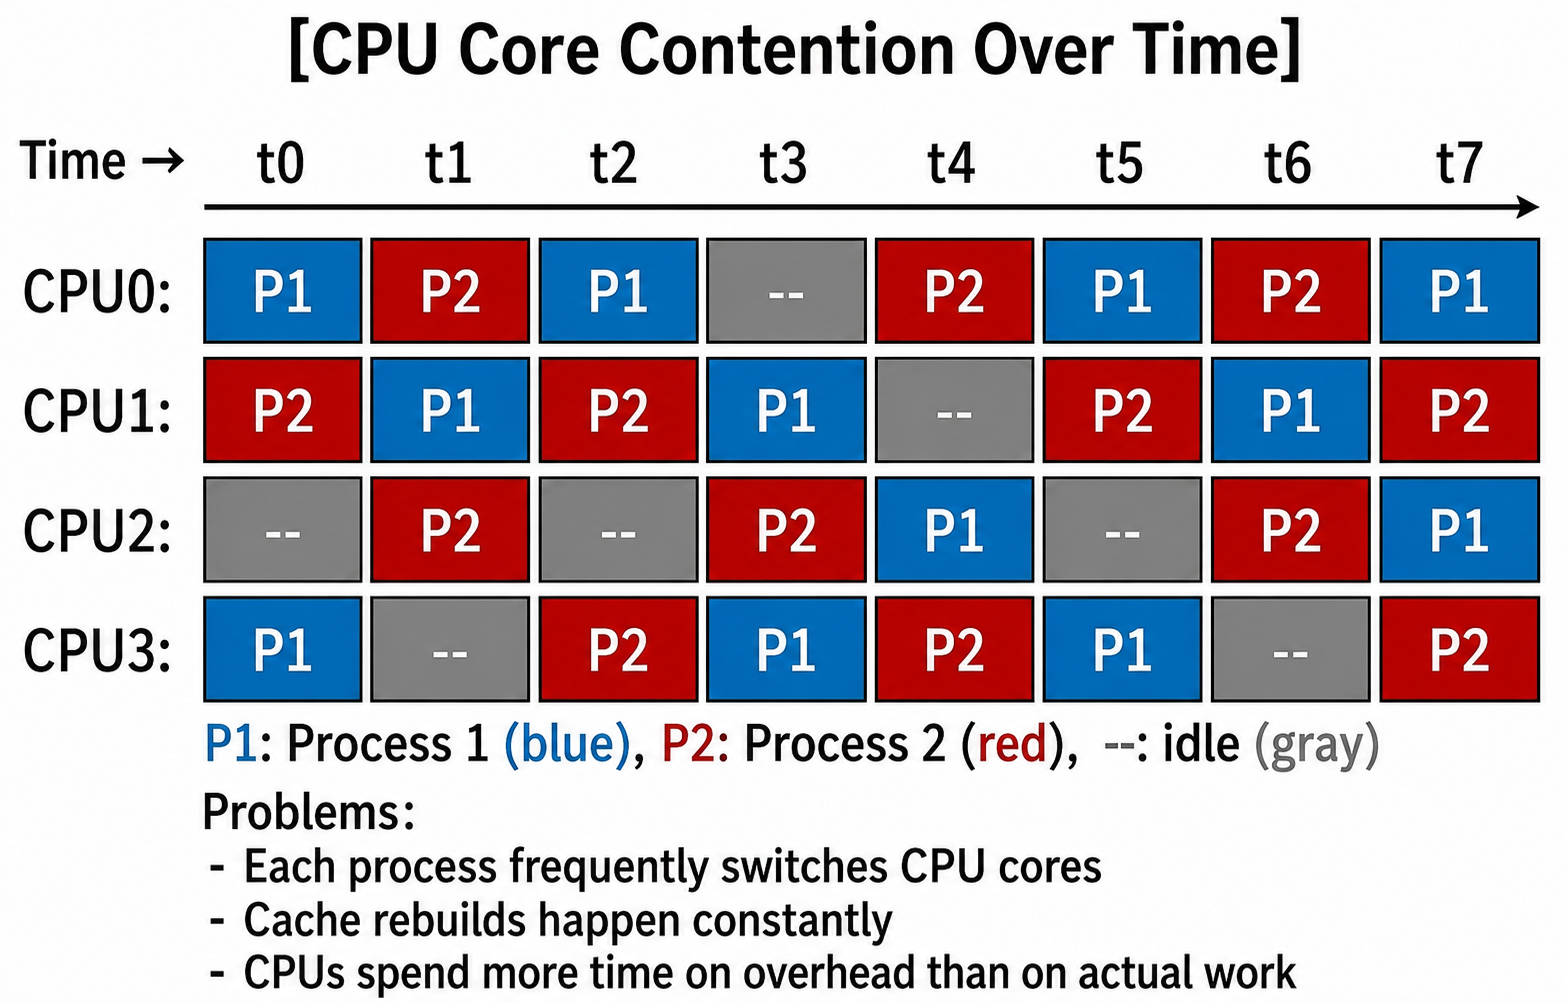
Result: cache contention and frequent context switches
→ Processing speed drops significantly
After applying taskset
Once you set CPU affinity with the taskset command, the situation improves dramatically
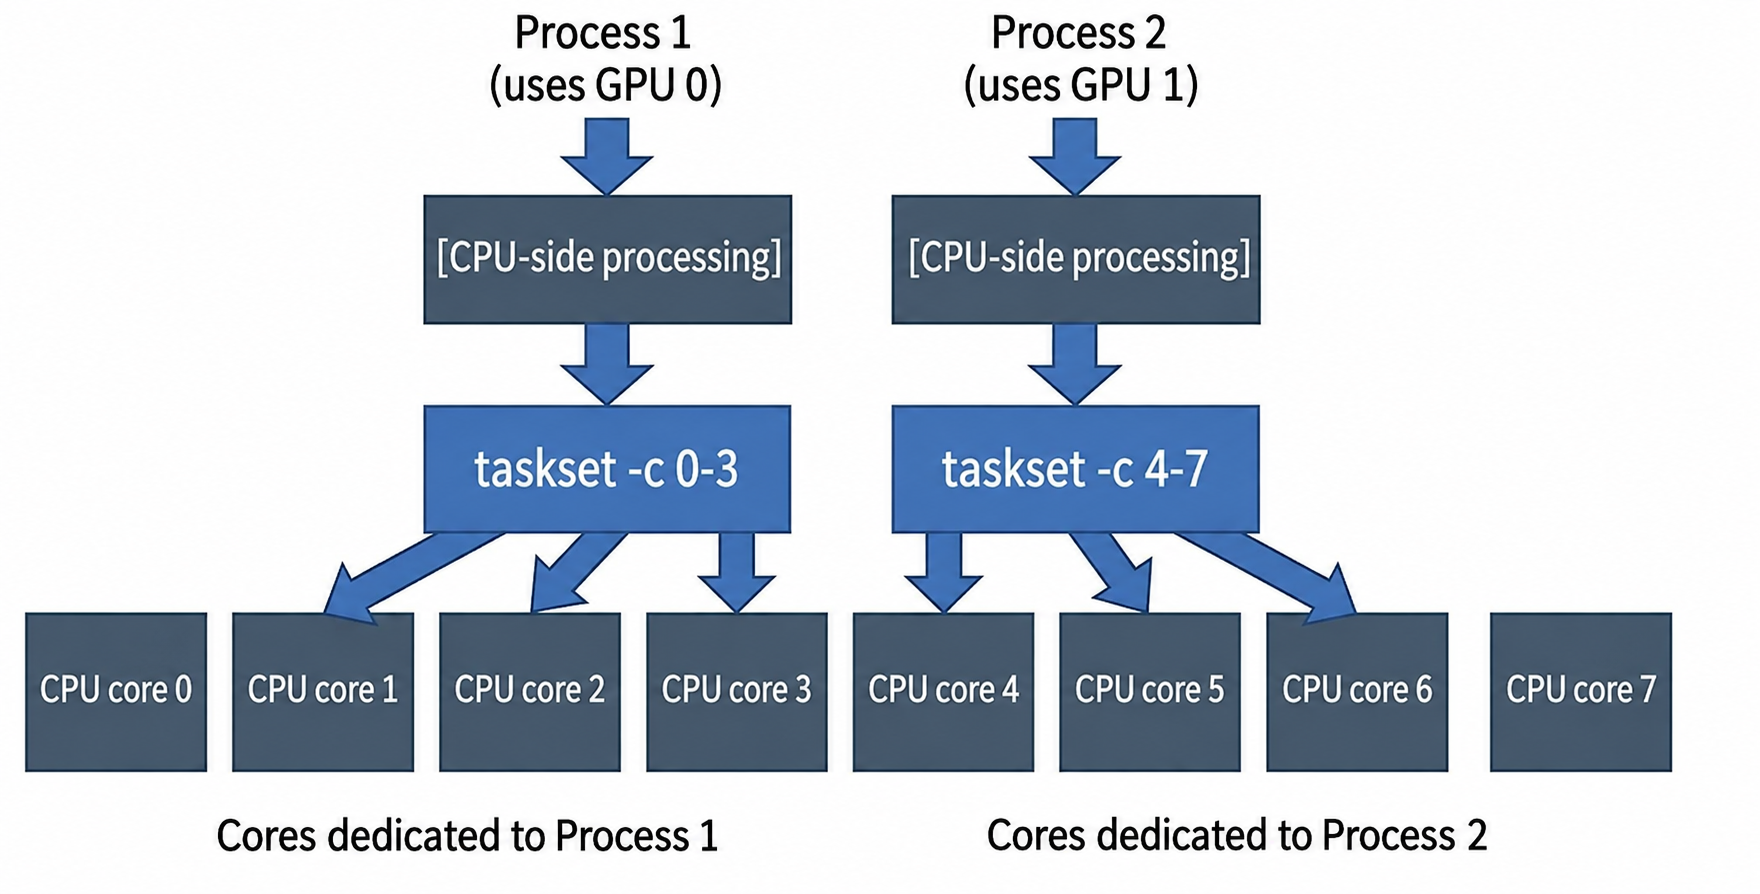
Result: no cache contention, minimal context switching
→ Each process maintains a stable processing speed
Why Such a Difference? A Closer Look at the Mechanism
How the Linux scheduler works
The CFS (Completely Fair Scheduler) implemented in the Linux kernel is designed to maximize overall system efficiency. It attempts to allocate CPU time "fairly" to every runnable process. Specifically, it tracks each process's accumulated runtime and picks the process with the least runtime to run next.
For typical workloads this mechanism works very well. However, when multiple CPU-intensive processes run at the same time, the scheduler keeps dynamically reassigning them across all available CPU cores. This "dynamic reassignment" is precisely what causes the serious performance problem.
The cache hierarchy and its impact
To understand why CPU resource contention is so damaging, let us look at the CPU cache hierarchy
The CPU cache hierarchy
Modern CPUs carry multiple levels of cache memory to hide the latency of main-memory access
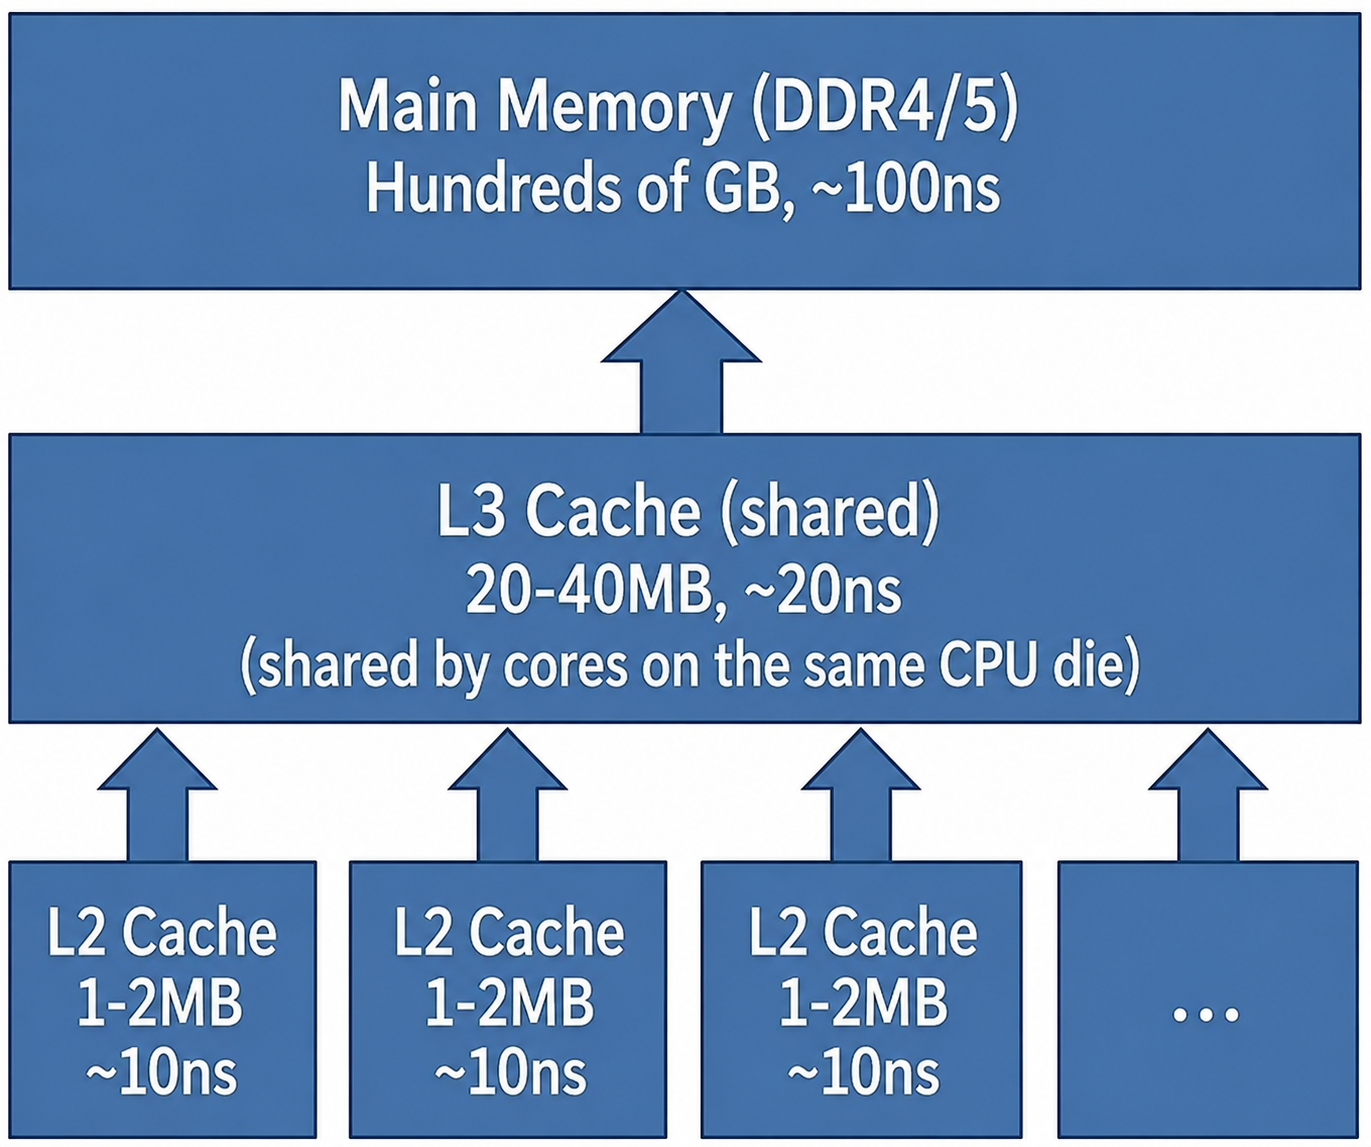
Key properties
- L1/L2 cache: dedicated to each CPU core, holding data for the process running on that core
- L3 cache: shared by all cores on the same CPU die (on 12th-gen and later Intel Core it may be partitioned between P/E cores; on Xeon it is per socket)
- Access speed gap: from L1 cache (4 ns) to main memory (100 ns) — a difference of more than 25x
How cache contention degrades performance
With this hierarchy in mind, here is what happens when multiple processes fight over the same CPU cores:
1. Cache pollution and invalidation
Tracing what happens over time when a process switches CPU cores looks like this.
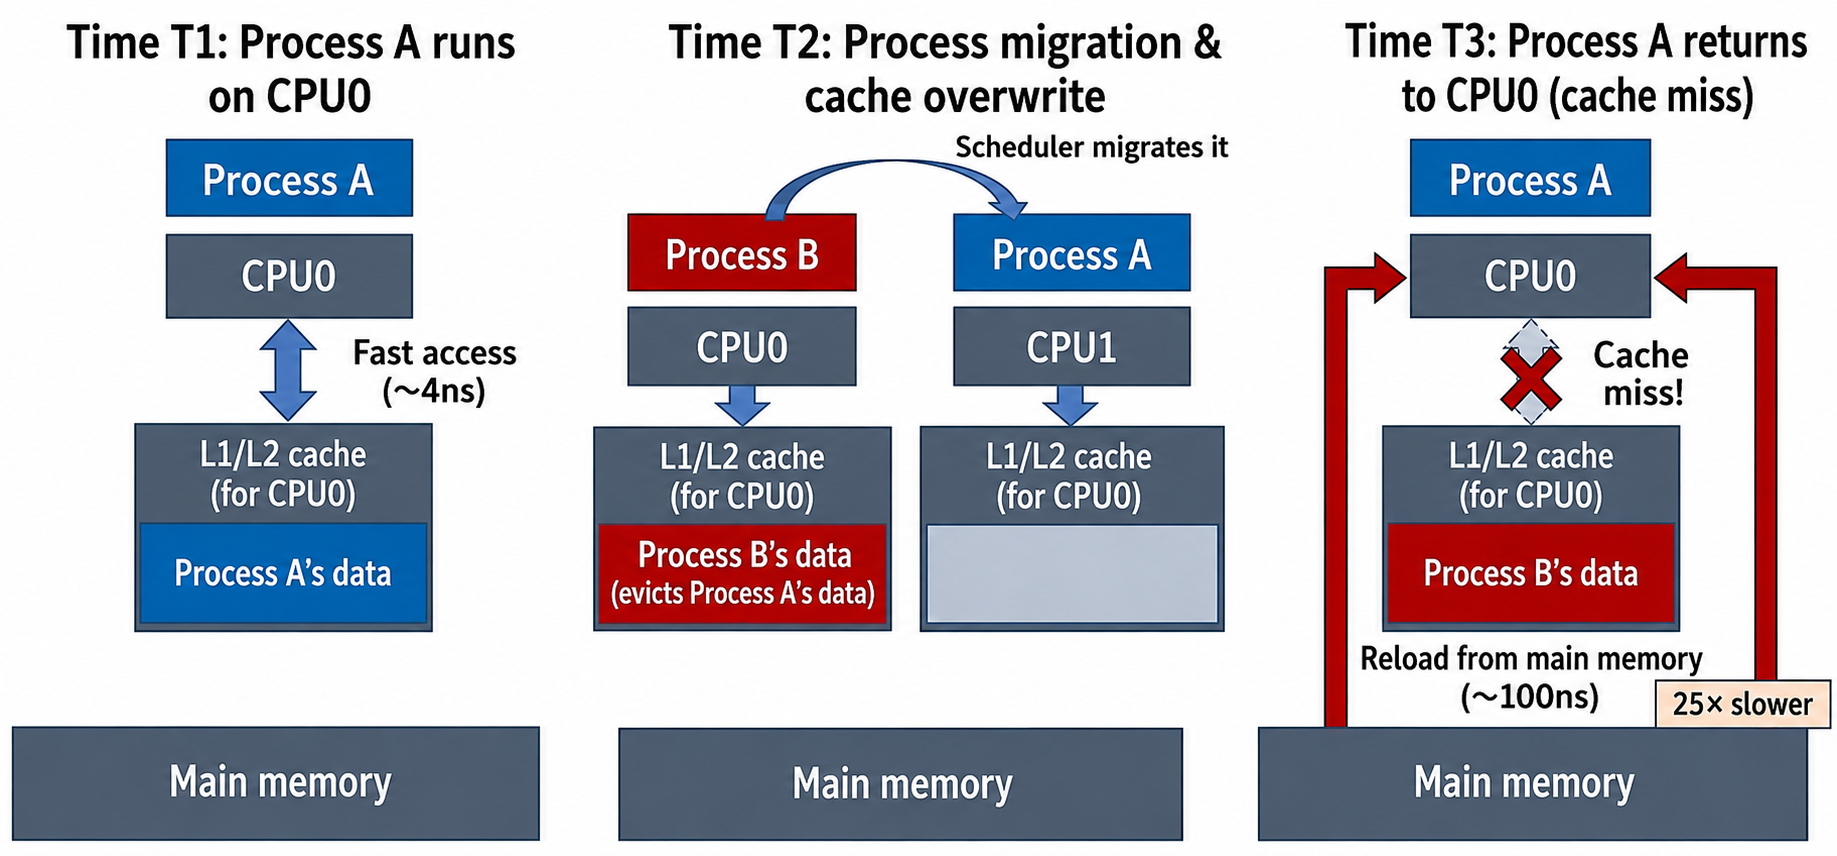
When a process migrates between cores like this, cache locality is lost, accesses to slow main memory increase, and performance degrades significantly
2. Cache thrashing
On top of that, frequent process switching pushes the system into a vicious cycle like this
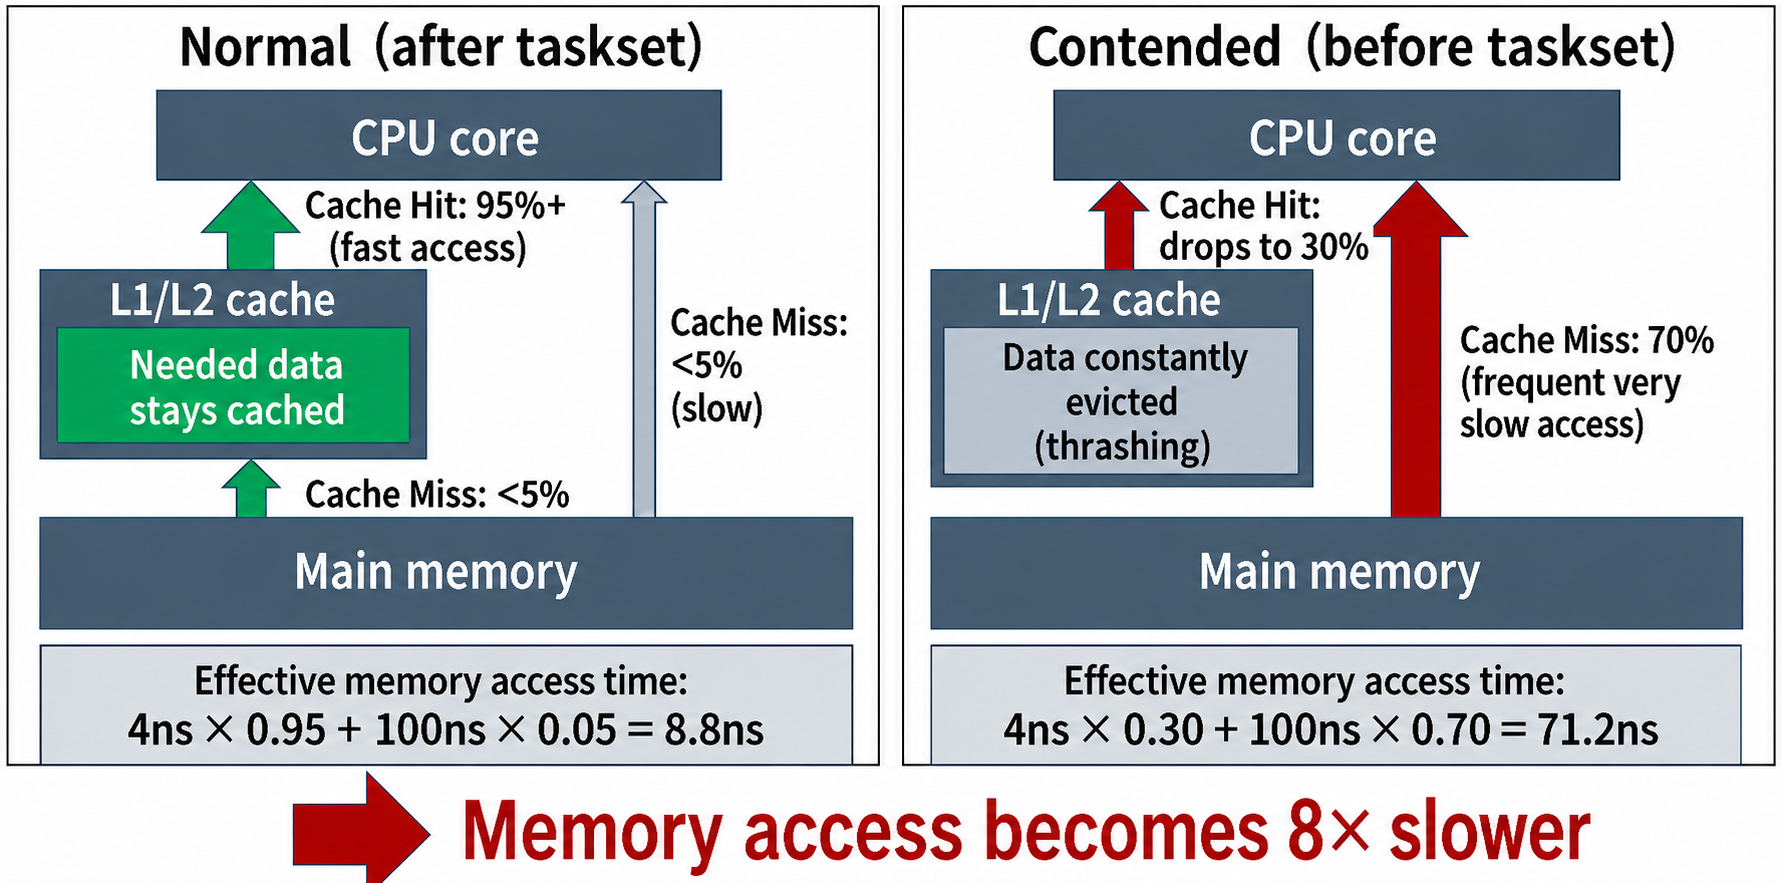
Memory bandwidth contention
Furthermore, when CPU-intensive work touches large volumes of data, memory bandwidth contention also occurs. As cache misses increase, accesses to main memory increase and memory bandwidth comes under pressure
- Theoretical bandwidth: roughly 51.2 GB/s with DDR4-3200
- With cache hits: memory bandwidth utilization around 5%
- With frequent cache misses: memory bandwidth utilization above 70%
When multiple processes miss the cache simultaneously, contention also arises at the memory controller, adding yet more delay.
Combine these factors, and even running just two processes can more than double the processing time.
That is why setting CPU affinity with taskset is such a simple yet effective approach — it resolves all of these problems in one stroke.
Considerations for the Xeon series
When you use Intel Xeon processors, especially in multi-socket configurations, ignoring the NUMA (Non-Uniform Memory Access) architecture will land you in a swamp of trouble.
What is NUMA?
NUMA is a memory access optimization technique for systems with multiple CPU sockets. Each CPU socket has its own dedicated memory controller and local memory, and this combination is called a "NUMA node."
The key property: a CPU can access local memory belonging to its own NUMA node quickly (about 70-100 ns), but accessing memory on another NUMA node (remote memory) must traverse QPI (QuickPath Interconnect) or UPI (Ultra Path Interconnect), incurring 1.5-2x the latency (about 150-200 ns).
Why NUMA optimization matters
Placing processes without regard to the NUMA topology leads to the following problems — and into the swamp.
- Unbalanced memory access
If a process runs on a Socket 0 CPU while its memory is located on Socket 1, every memory access has to cross the UPI link, causing a substantial performance drop. - Memory bandwidth contention
When multiple processes access the same memory bank from different sockets, the UPI link bandwidth (up to about 41.6 GB/s) becomes the bottleneck. Compared with local memory bandwidth (about 140 GB/s with DDR4-2933), that is a severe limitation. - Cache coherency overhead
When data is shared across sockets, the snoop traffic required to keep caches coherent adds even more latency.
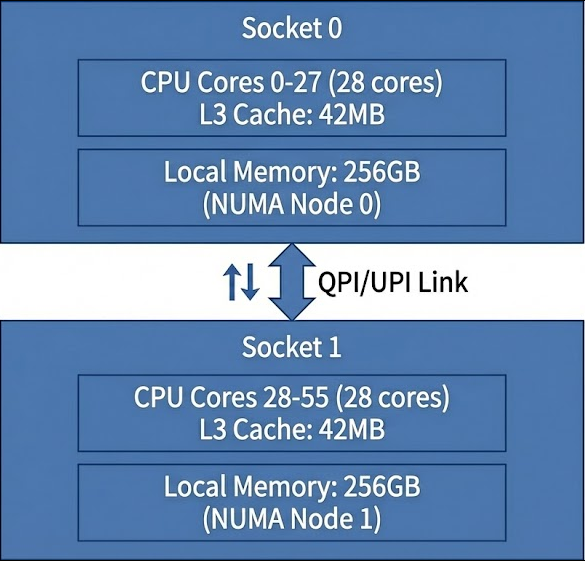
So on Xeon, assigning processes per NUMA node is essential
# Process 1: use the CPUs and memory of NUMA Node 0
numactl --cpunodebind=0 --membind=0 taskset -c 0-27 python process1.py --gpu 0

# Process 2: use the CPUs and memory of NUMA Node 1
numactl --cpunodebind=1 --membind=1 taskset -c 28-55 python process2.py --gpu 1
Memory access across NUMA nodes incurs roughly 1.5-2x the latency of local access. Keeping each process's CPU cores and memory within the same NUMA node minimizes memory access latency and delivers a substantial performance boost.
Toward the Solution
After all this digging into the CPU, the path to solving the problem became clear.
The solution is simple: control which processes run on which cores. For that, the taskset command is exactly the right tool.taskset is a powerful Linux tool for pinning a process to a specific set of CPU cores (setting its affinity).
Now, let us look at how to use taskset in each environment.
Example on the Intel Core series
An implementation example using an Intel Core i9-13900K (8 P-cores + 16 E-cores)
# Check the P-cores (usually 0-15 are P-cores + HTT)
lscpu --all --extended | grep "Core"

# Process 1: use the first half of the P-cores
taskset -c 0-7 python heavy_process1.py --gpu 0

# Process 2: use the second half of the P-cores
taskset -c 8-15 python heavy_process2.py --gpu 1

# Send lightweight background tasks to the E-cores
taskset -c 16-31 python background_task.py
Example on the Intel Xeon series
Using a Xeon Gold 6348 (28 cores x 2 sockets)
# Check the NUMA nodes
numactl --hardware

# Process 1: use Socket 0 cores (NUMA-optimized)
numactl --cpunodebind=0 --membind=0 \
  taskset -c 0-27 python process1.py --gpu 0

# Process 2: use Socket 1 cores (NUMA-optimized)
numactl --cpunodebind=1 --membind=1 \
  taskset -c 28-55 python process2.py --gpu 1
Implementation in Windows Subsystem for Linux (WSL)
The same optimization works in a WSL environment as well.
@echo off
setlocal enabledelayedexpansion

rem Get the system's CPU information
for /f "tokens=*" %%a in ('wsl -e lscpu ^| grep "Model name"') do set CPU_MODEL=%%a
echo CPU Model: %CPU_MODEL%

rem Check the CPU core count (via WSL)
for /f "tokens=*" %%a in ('wsl -e nproc') do set TOTAL_CORES=%%a
echo Total CPU cores: %TOTAL_CORES%

rem Check the number of NUMA nodes
for /f "tokens=*" %%a in ('wsl -e lscpu ^| grep "NUMA node(s)" ^| awk "{print $3}"') do set NUMA_NODES=%%a
echo NUMA nodes: %NUMA_NODES%

rem Choose the optimal settings for the CPU model
if "%NUMA_NODES%"=="2" (
    echo Detected dual-socket system, using NUMA optimization

    rem Compute the core range for Socket 0
    set /a CORES_PER_SOCKET=%TOTAL_CORES%/2
    set /a SOCKET0_END=%CORES_PER_SOCKET%-1

    rem Compute the core range for Socket 1
    set /a SOCKET1_START=%CORES_PER_SOCKET%
    set /a SOCKET1_END=%TOTAL_CORES%-1

    rem Launch workers with NUMA optimization
    start "Worker 1 (NUMA 0)" wsl -e bash -ic "numactl --cpunodebind=0 --membind=0 taskset -c 0-%SOCKET0_END% python worker.py --gpu 0 --worker-id 1"
    start "Worker 2 (NUMA 1)" wsl -e bash -ic "numactl --cpunodebind=1 --membind=1 taskset -c %SOCKET1_START%-%SOCKET1_END% python worker.py --gpu 1 --worker-id 2"
) else (
    echo Detected single-socket system, using simple core partitioning

    rem Split the CPU cores into two groups
    set /a HALF_CORES=%TOTAL_CORES%/2
    set /a SECOND_HALF_START=%HALF_CORES%
    set /a SECOND_HALF_END=%TOTAL_CORES%-1

    rem Launch workers with simple core partitioning
    start "Worker 1" wsl -e bash -ic "taskset -c 0-%HALF_CORES% python worker.py --gpu 0 --worker-id 1"
    start "Worker 2" wsl -e bash -ic "taskset -c %SECOND_HALF_START%-%SECOND_HALF_END% python worker.py --gpu 1 --worker-id 2"
)

echo All workers started successfully
Example batch file that adapts its configuration to the CPU architecture
Summary and Outlook
In developing GPU-based distributed processing systems, focusing on GPU-side optimization is of course important, but this experience reminded us that surveying the entire processing pipeline and hunting down hidden bottlenecks matters just as much.
As for the CPU, our attitude had been roughly
"as long as there is enough bandwidth to the GPU and the CPU is reasonably capable, we are fine"
— we had never thought about it very deeply, so this incident was a genuine lesson.
We suspect scenarios like this one — a CPU-intensive step inside the pipeline becoming a serious bottleneck under parallel multi-process execution — are actually quite common.
taskset command-based CPU affinity setting turned out to be a simple, effective solution to this kind of problem.
Especially on multi-socket systems like the Intel Xeon series, combining it with NUMA optimization looks capable of delivering dramatic performance gains.
On the other hand, when using recent generations of the Intel Core series, understanding the P-core/E-core hybrid layout and placing tasks appropriately becomes essential.
Our GPU server fleet is currently built primarily on Intel architectures, but
with AMD's chiplet designs, the spread of ARM servers, and whatever else the future brings, we intend to keep a firm grasp of these CPU fundamentals and apply them to what we build next.
Thank you for reading to the end!
See you next time!