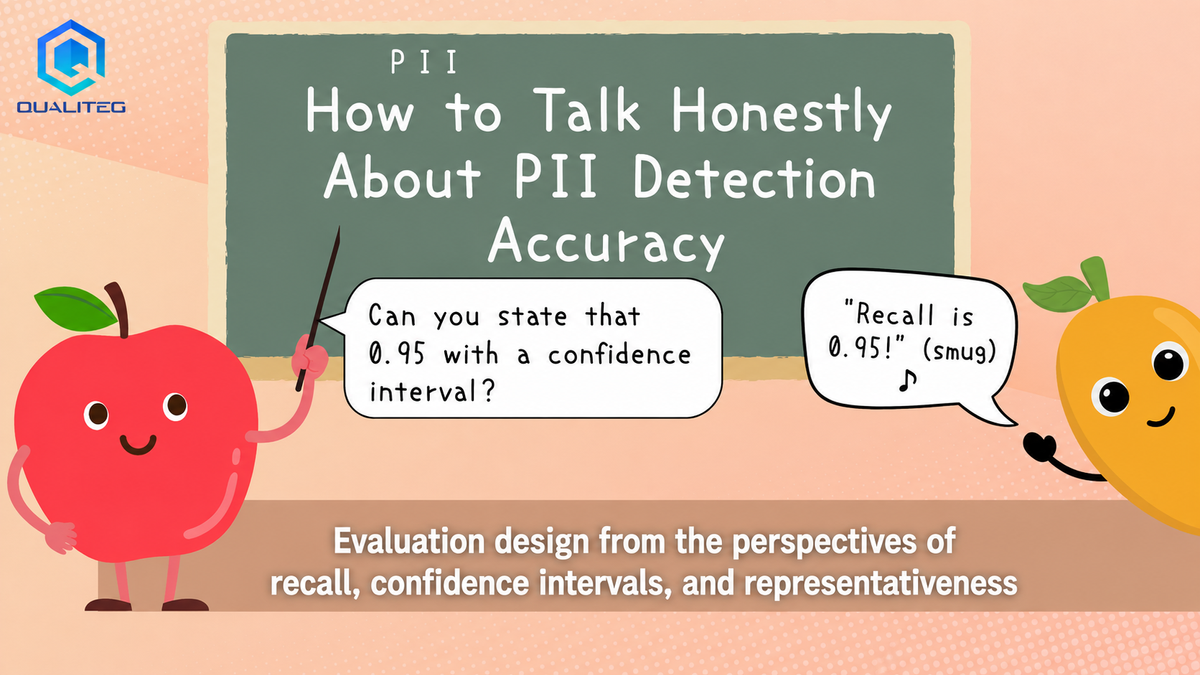
How to Talk Honestly About PII Detection Accuracy: Evaluation Design Through Recall, Confidence Intervals, and Representativeness
Hello. This is the Qualiteg Research Team.
We work on technology for detecting and masking sensitive information — personal information (PII), confidential information, and special-care-required personal data (https://pii-fi.com).
In that work, the question we face every day is:
「how can we talk about accuracy figures honestly and correctly」
?
Suppose, for example, that a detector's recall is 0.95.
That looks like a high number. But on which kinds of documents was it measured? How was the ground truth built? Is the sample size sufficient? Can the same figure be applied to other business documents?
An accuracy figure, on its own, means almost nothing.
Only when paired with "what was counted, under which conditions, and how" does it become a number you can use in practice.
In this article, we share the thinking we have developed while evaluating PII detection accuracy — a way to speak about accuracy with integrity. The focus is on how to evaluate, not on the internals of the algorithm.
1. Introduction: should you believe "our recall is 0.95"?
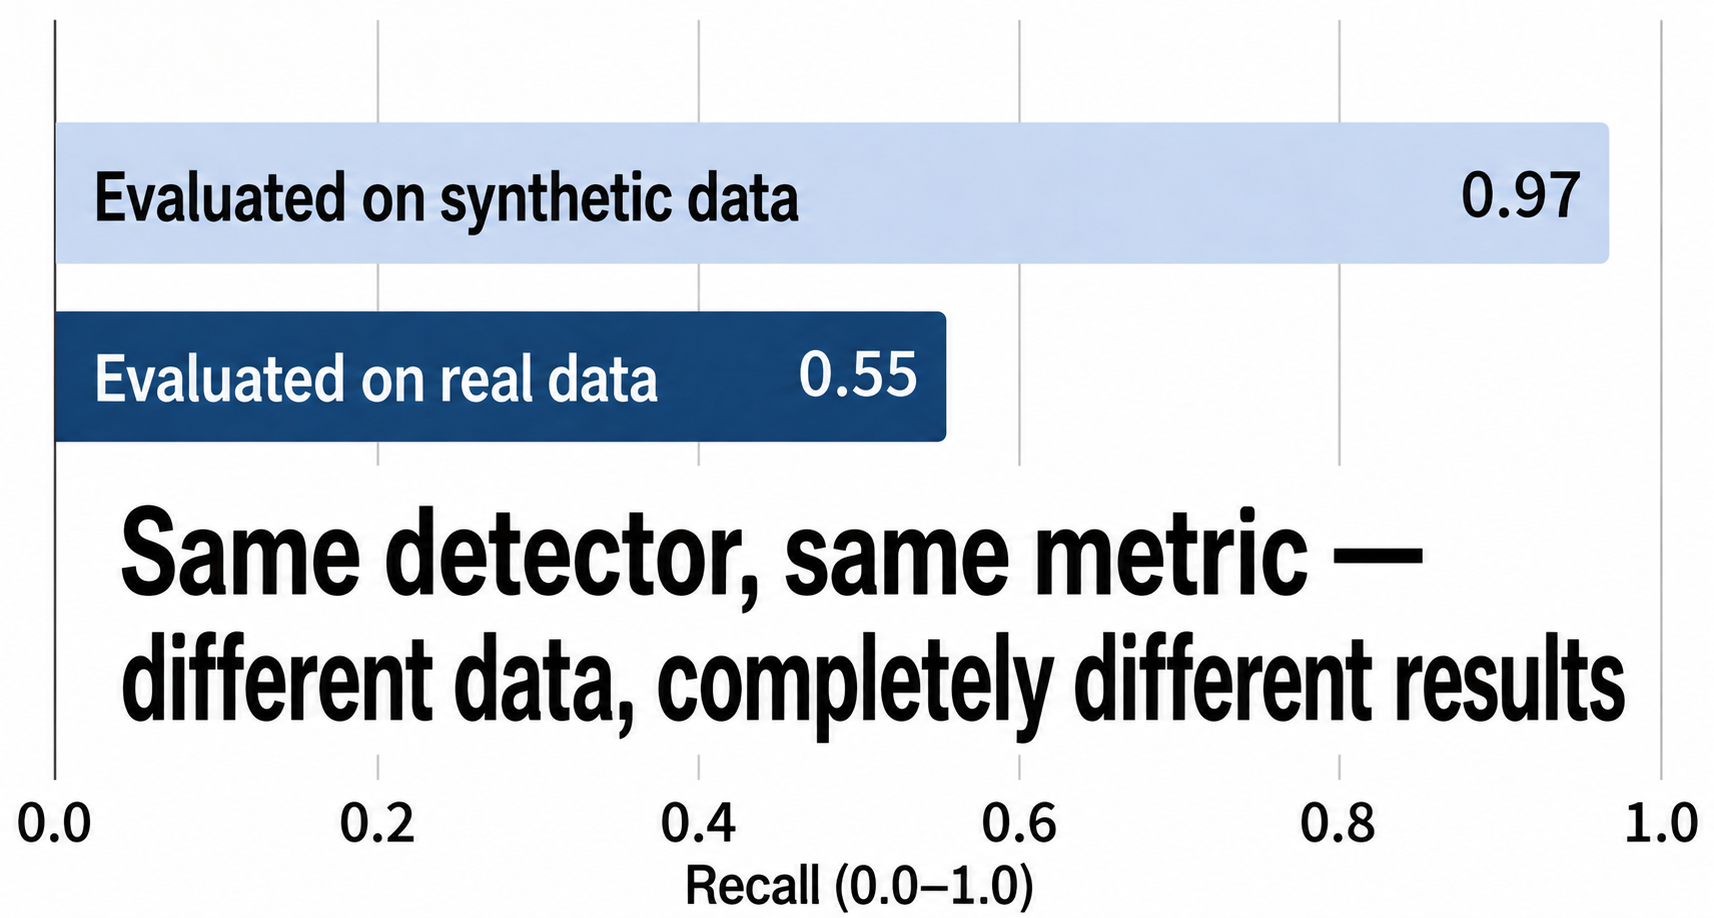
Early in development, we measured accuracy on synthetic data we had prepared in-house (artificially created test documents) and obtained very high numbers.
Nearly zero misses, or so it seemed.
However, when we re-measured on real documents, the numbers fell substantially。
The reason was simple: the synthetic data contained only "the patterns we had imagined," and did not reflect the diversity, messiness, and surprises of real documents.
Looking back, that synthetic data had a bias — large numbers of slight variations on the same answers — which inflated the apparent score. It was, so to speak, writing our own exam, taking it ourselves, and scoring a perfect grade.
The lesson was very clear:
an accuracy figure means nothing unless paired with what it was measured on and how.
"We got 0.95" says, by itself, essentially nothing.
Think of this article as an exploration of how far you must pin down that "on what, and how" before a number deserves your trust.
2. Why misses are what matter most
In PII detection and masking, the miss (the leak-through) is the most frightening kind of error.
Over-detection degrades readability and business value. Over-masking contracts, medical documents, or inquiry histories can erase information needed for business decisions, or hinder audit, search, and analysis.
By contrast, a miss leaves personal or confidential information intact, which tends to be the graver risk in external sharing and secondary use.
In other words, the two error types carry asymmetric costs.
- Miss (leak-through)
Personal or confidential information remains as-is. An especially heavy risk in external sharing and secondary use. - Over-detection (over-masking)
Degrades readability and business value. A different kind of risk from a miss.
That is why we treat recall as our most important metric.
That said, over-detection cannot be tolerated without limit. Mask everything and recall rises trivially — and the output becomes useless.
「Reduce misses to the practical limit while keeping over-detection within a usable range」
— evaluation has to happen inside that tug-of-war.
And what we value even more than achieving high recall is "measuring recall correctly, and stating it correctly."
If the measurement is sloppy, even a high number is a castle built on sand.
So let us start from the foundations of that "measurement."
3. The confusion matrix as the foundation
Every discussion of accuracy begins with a simple table: the confusion matrix.
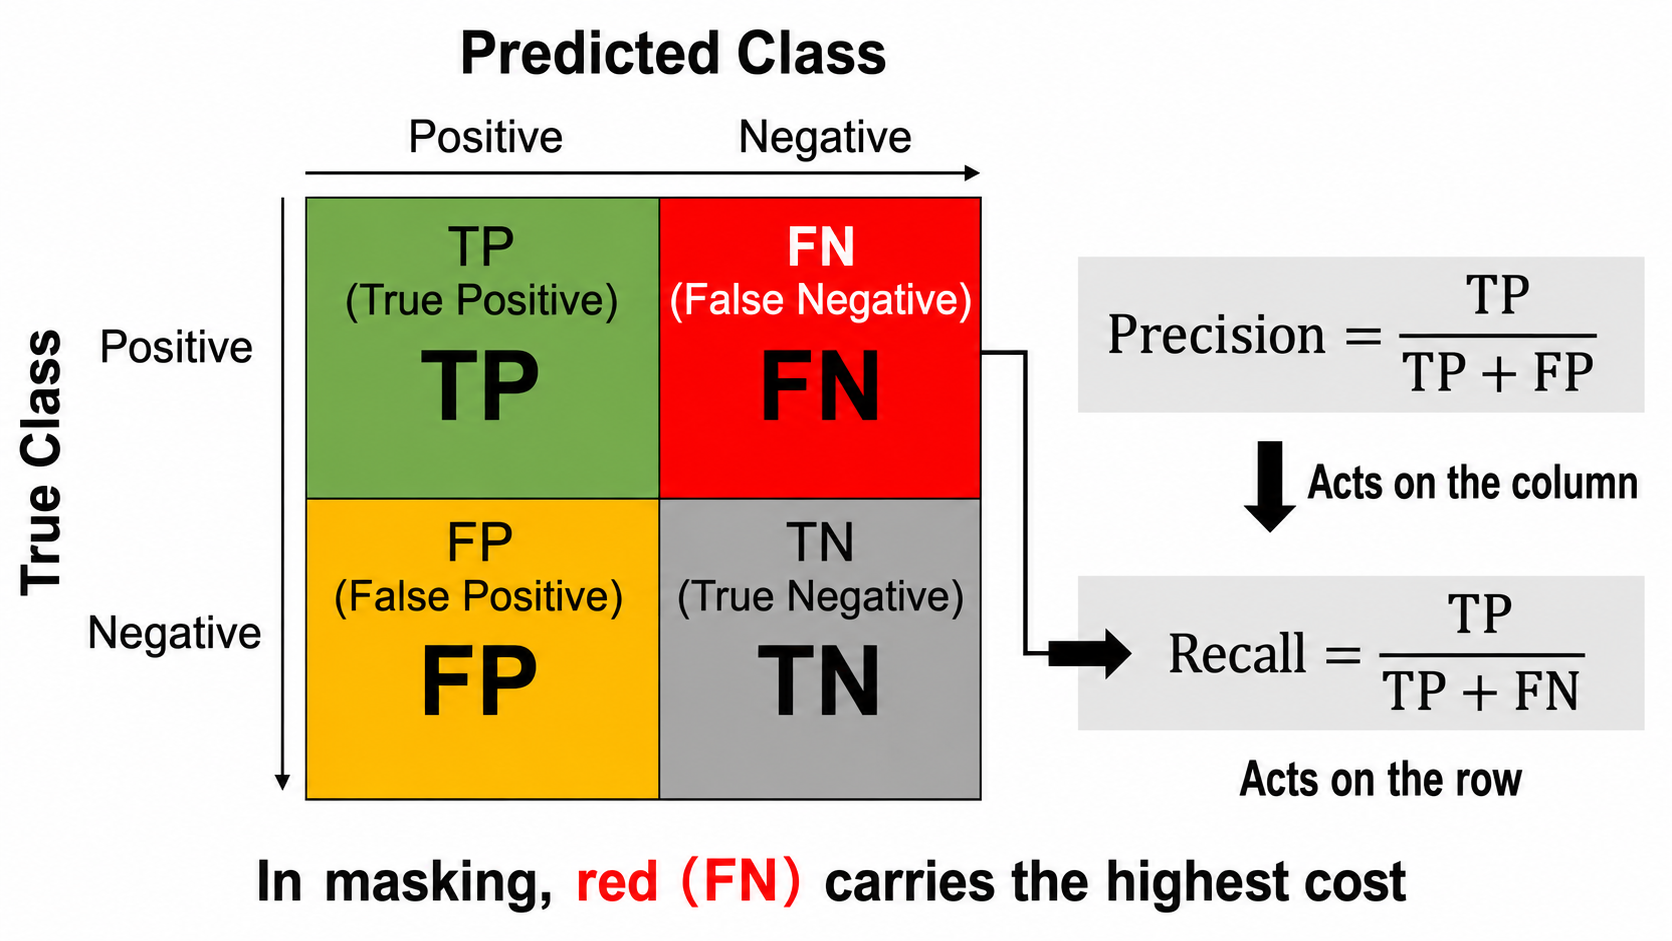
It splits detection results into four cells by combining "ground truth (is it actually PII?)" and "prediction (did the detector flag it as PII?)."
| Predicted: detected | Predicted: not detected | |
|---|---|---|
| Truth: is PII | TP (correctly detected) | FN (miss) |
| Truth: is not PII | FP (over-detection) | TN (correctly not detected) |
| Symbol | Japanese term | Meaning |
|---|---|---|
| TP (True Positive) | 真陽性 | PII was correctly detected. |
| FP (False Positive) | 偽陽性 | Something that is not PII was wrongly detected (over-detection). |
| FN (False Negative) | 偽陰性 | PII was missed (leak-through). The most critical error — it leads to leaks. |
| TN (True Negative) | 真陰性 | Something that is not PII was correctly left undetected. |
From these, the commonly used metrics are defined.
- Precision = TP ÷ (TP + FP): of everything detected, the share that was truly PII. "How little over-detection."
- Recall = TP ÷ (TP + FN): of everything that should have been detected, the share actually detected. "How little leak-through."
- F1 score: the harmonic mean of precision and recall. Used when you want a single number for their balance.
Here are two pitfalls specific to PII detection as an extraction task.
(1) TN (what was correctly not detected) is effectively uncountable.
The "places where nothing was detected" in a document are innumerable if you think character by character or word by word. So metrics that use TN — Accuracy, for example — are nearly meaningless for this task.
Since "most of a document is not PII," Accuracy comes out extremely high even if you detect nothing at all.
That is why we do not use Accuracy, and speak in terms of Precision, Recall, and F1.
(2) "Hit or miss" depends on how you treat positional offsets.
PII appears in documents as spans (ranges of text).
The detected span does not always match the ground-truth span exactly. An address, for instance, might be detected one character short at the end. Whether such partial offsets count as hits or misses changes the numbers. Our approach: first judge by "did we capture the right kind of entity at roughly the right location (overlap-based)", and then separately track "the share of spans matched exactly (boundary agreement rate)" — checking quality in two stages.
So even the same word "recall" moves with definitional choices such as the treatment of TN and of positional offsets.
That is why, before any number, sharing "how we counted" matters so much.
4. The trap of a single number: confidence intervals (CI)
Once definitions are aligned, the next question is how much to trust the number.
When you write "recall 0.95," that is nothing more than a point estimate.
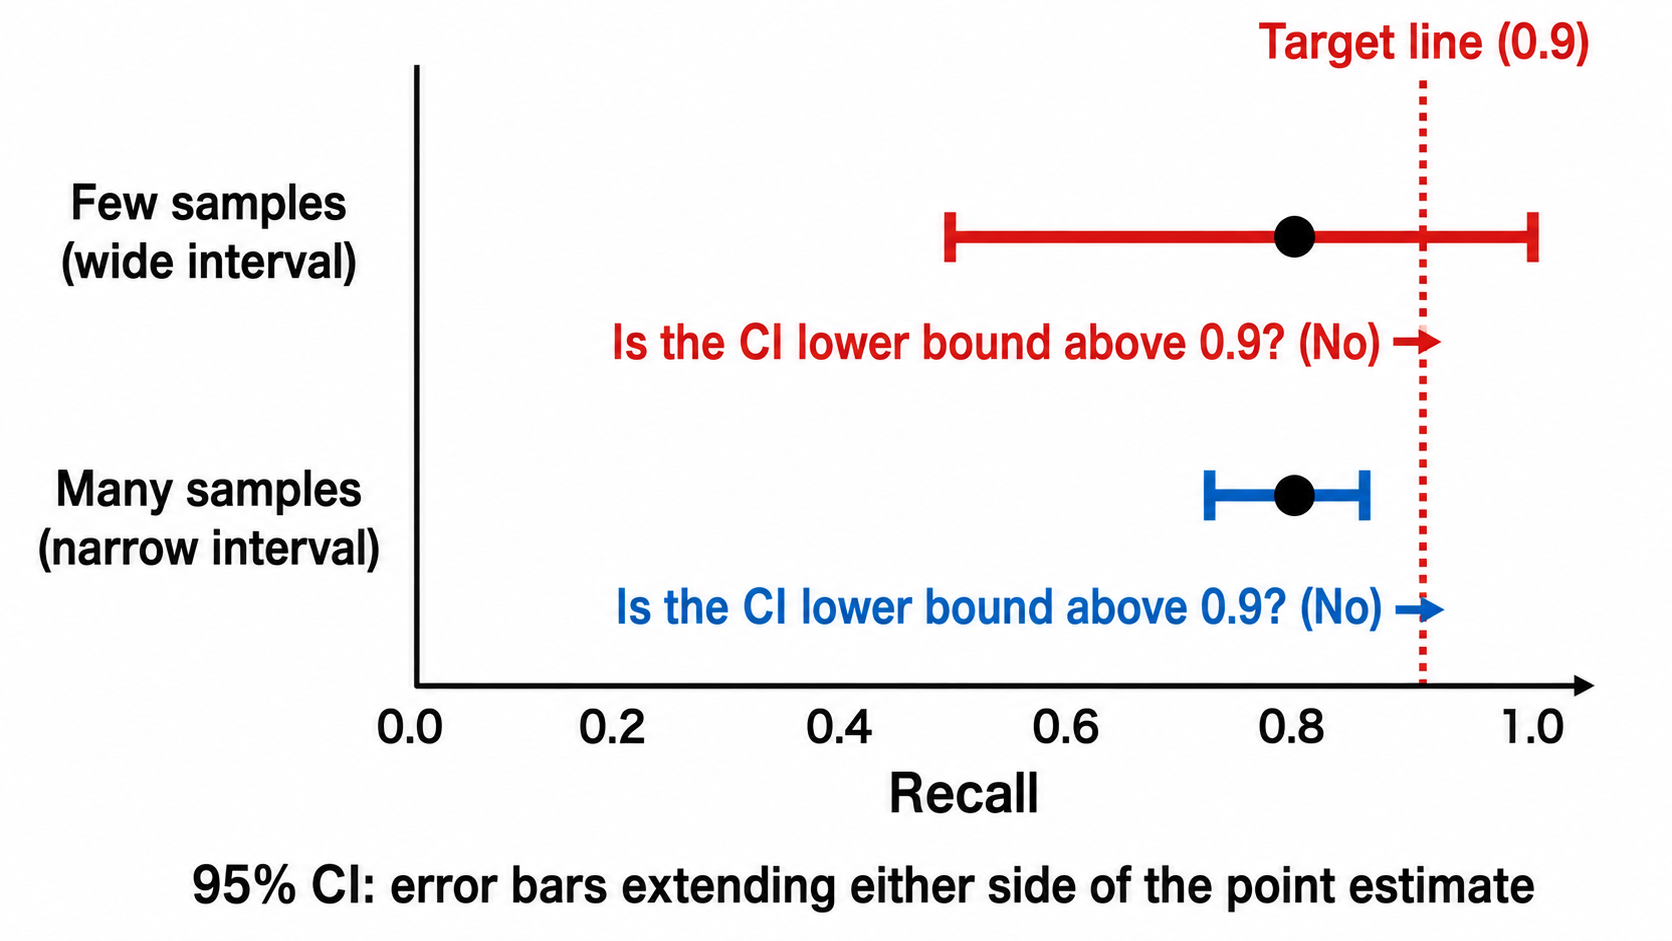
With few evaluation documents, luck — good or bad — adds substantial noise.
To put it starkly, a 0.95 measured on 5 documents and a 0.95 measured on 500 deserve completely different levels of trust.
So we always handle figures with a confidence interval (CI) attached.
For example, "0.95 (95% CI 0.88–0.98)" — we speak in ranges. As samples grow, the range narrows.
For proportions (recall is a proportion: the share of true positives among all positives), we compute intervals using methods that do not go to extremes on small samples.
In practice, we use not just the simple normal approximation but methods that hold up on small samples, such as the Wilson interval and the Clopper–Pearson interval
(we will not go into the formulas; this article is about evaluation philosophy, so we limit ourselves to naming the methods).
What we want to emphasize here is what a confidence interval does and does not represent.
- What a confidence interval represents
The fluctuation (sampling error) you would see if you drew another sample of documents of the same nature. - What a confidence interval does not represent
The shift that occurs when the kind of documents (the domain) changes
That is, even if one kind of document yields "0.88–0.98," that guarantees nothing whatsoever about performance on an entirely different kind of document。
As an analogy: a confidence interval
tells you "the variation if you fish the same pond again,"
but not "whether you will catch anything in a different pond"
.
Confuse the two, and "we score 0.9" starts wandering around on its own.
5. Change the domain, and performance becomes a different animal
"Personal information" manifests very differently depending on document type. Contracts, business reports, various logs, court opinions, medical records — each differs in vocabulary, writing style, and how PII appears.
Moreover, even the same "person name" may be written formally in some documents and appear in corrupted or abbreviated forms in others.
In our experience, what transfers easily across domains and what requires per-domain engineering divide quite cleanly.
- Transfers easily → information with clear formats (card numbers, IP addresses, various codes). Because the format is fixed, these stay relatively stable across document types.
- Strongly domain-dependent → proper nouns such as person names, organization names, and place names. Heavily dependent on vocabulary and context; when the document type changes, the failure modes change too.
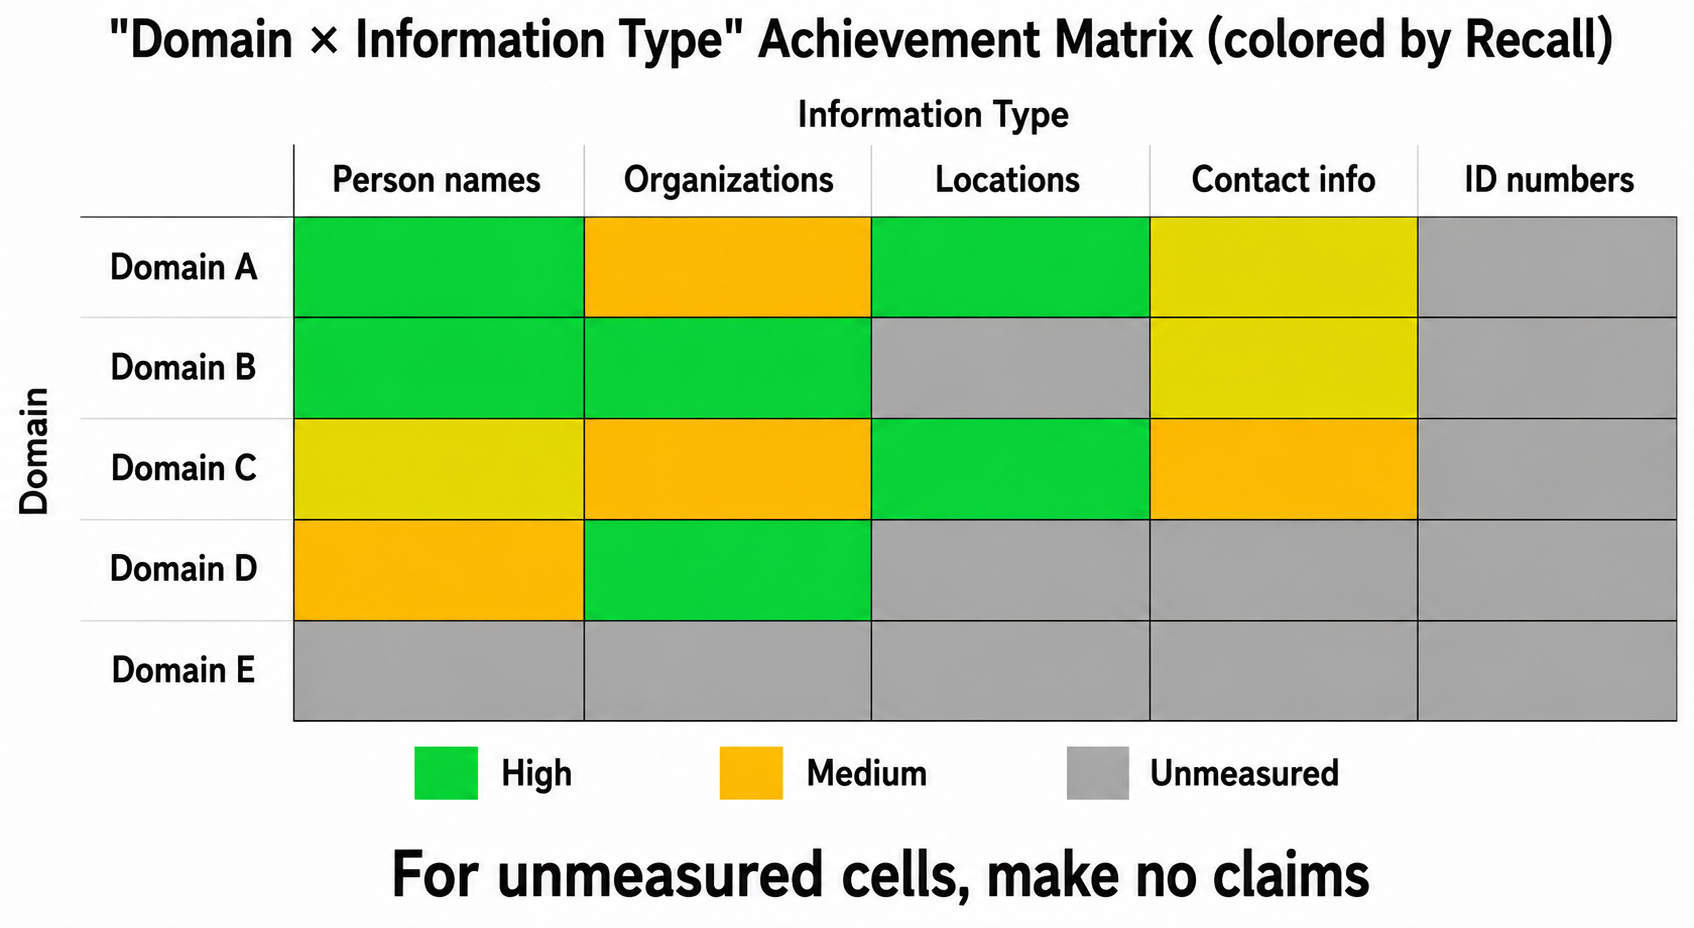
So the single word "recall" is, in reality, a separate number per information type and per domain. A high figure in one domain cannot simply be carried over to another. In most cases, carrying it over means it drops.
This fact may look inconvenient for anyone selling a product. It would be easier to say, in one line, "we get 0.9 on any document."
But saying so without grounds leads to the same mistake as the "perfect score on synthetic data" of our opening chapter.
So we have chosen — it takes some courage — to draw a clear line between what we can claim and what we cannot.
6. Growing the set of numbers we can claim, domain by domain
So how do you earn the right to say "high accuracy on any document"? Unfortunately, there is no shortcut.
For each domain, build a yardstick from that kind of document, and bring each one to 0.9, one at a time. Domains you have not measured, you do not claim.
The end state we aim for is a "domain × information type" matrix in which every cell meets the target — each backed by sufficient samples and a confidence interval.
What matters here is running the same loop, faithfully, in every domain.
- Prepare evaluation data (ground truth) for that domain's documents, with every instance of PII exhaustively annotated by hand
- Run the detector and, with confidence intervals attached, measure accuracy
- Break down misses and over-detections by information type and add engineering according to the cause
- Measure again. At this point, whether any other domain's accuracy has dropped (whether anything has regressed) must also always be checked
Steps 3 and 4 are the unglamorous, crucial ones.
Without breaking down "which types we are missing" — rather than "0.9 overall" — you cannot decide on the next improvement.
And since a change that improves one domain routinely degrades another, you need machinery that re-runs every past evaluation after each improvement to confirm nothing has regressed.
7. The grounds for claiming "strong representativeness"
To claim that your evaluation data "properly represents reality," you need backing not from intuition but from how the data was collected and how the numbers were produced.
Here is the checklist we use, with the reasoning for each item.
- Define the population
Decide first what you want to represent. With the scope left vague, "representative" is not a claim you can make. - Random (ideally stratified) sampling
Sample randomly from the whole target. Better still, add "stratification" — allocating by type to prevent bias.With hand-picked evaluation data, no score, however good, supports a claim of representativeness. - Show distribution match
Show numerically that the evaluation data's composition (document types, lengths, information-type ratios) is close to the population's. - Sufficient sample size
Secure enough volume that the confidence interval narrows to a practical width. Rare information types, in particular, need to be collected in extra quantity, deliberately. - No leakage
The evaluation data must not have been used to tune or train the detector. Break this, and you are solving "questions you already know the answers to" — the numbers come out optimistic. - Temporal holdout
Measure on new documents from after the system was built. This validates past optimization against future data. - Fix metrics and ground truth in advance
Do not adjust conditions after the fact to fit the evaluation
(no "peeking," so to speak). - Reliability of the ground truth itself
Check inter-annotator agreement across multiple annotators. If the yardstick is warped, every number built on it becomes suspect. - Stability
Confirm that adding samples does not move the numbers much
(the evaluation curve of the next chapter). - Replication on a separate sample
Prepare an independent second set and confirm the same numbers come out.
This is the strongest evidence of all.
Being able to disclose honestly how far you satisfy these — that is the actual substance of a claim of "strong representativeness."
Conversely, accuracy figures presented without touching on any of these cannot be taken at face value.
8. The evaluation curve: judging "we have measured enough" by a curve, not by feel
"How many documents must we evaluate before we can trust the number?"
We answer this question with an evaluation curve.
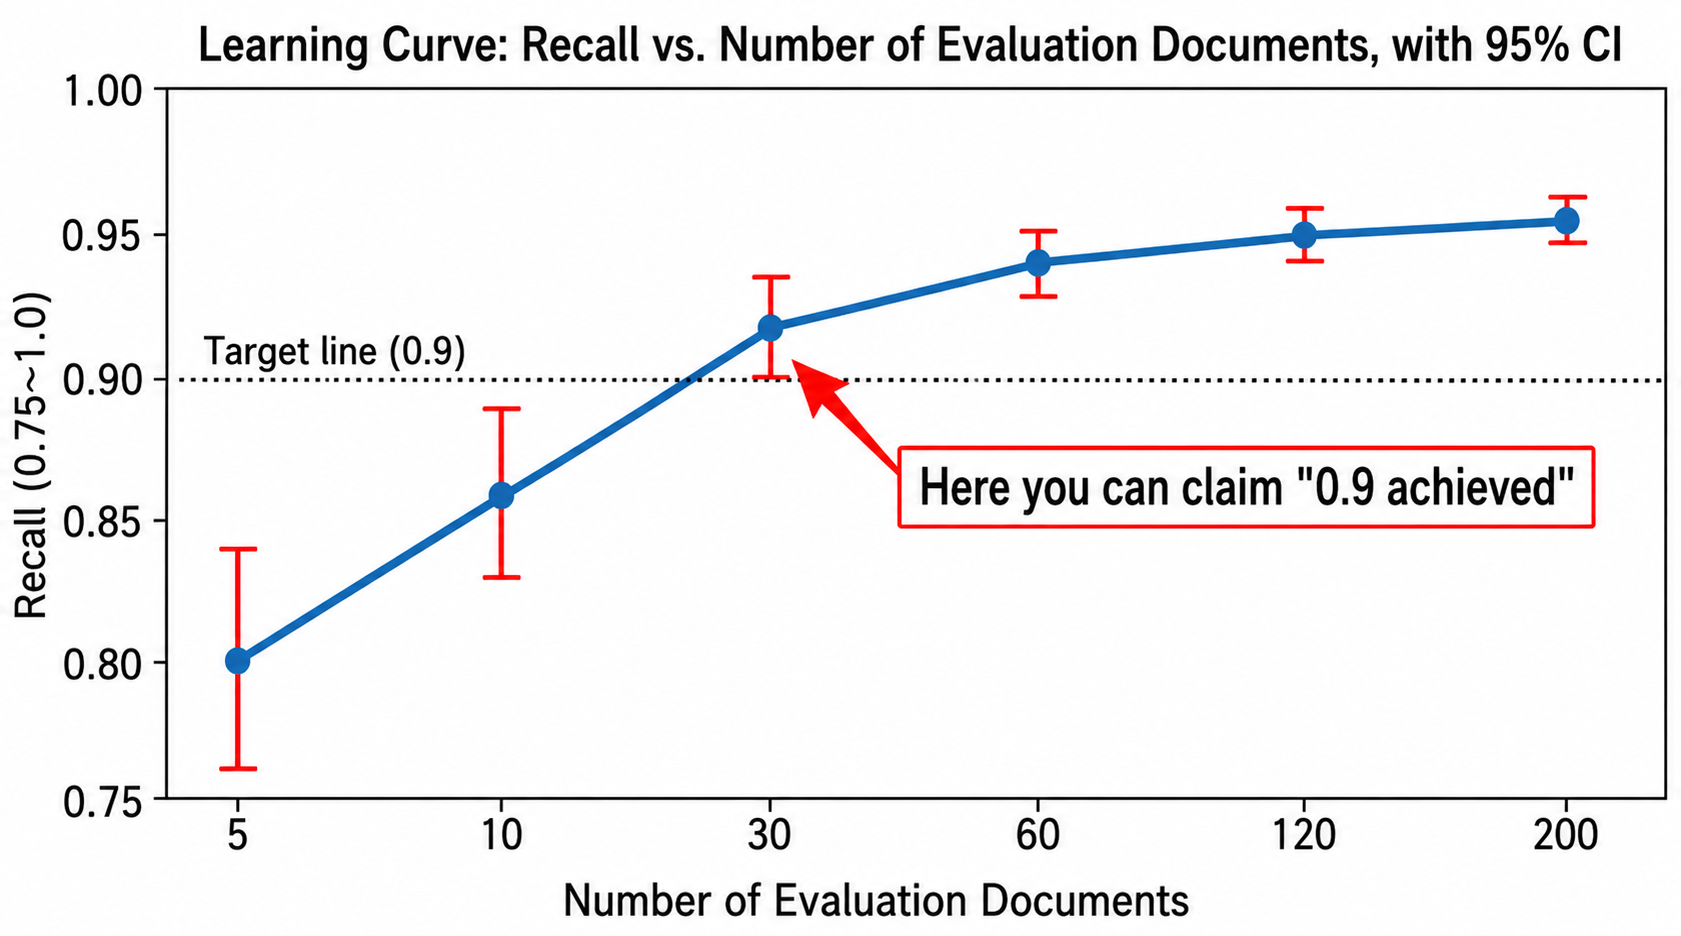
We grow the evaluation data bit by bit, recording the recall point estimate and confidence interval as we go.
The table below shows how the estimate and interval move as evaluation samples increase — these are illustrative example values. They are not raw measurement logs; the values have been tidied to make the trend easy to see
(with real data, the point estimates at n=120 and n=200 would rarely coincide this neatly)
| Documents evaluated | Spans evaluated | Recall (point estimate) | 95% confidence interval | Interval half-width |
|---|---|---|---|---|
| 5 | ~60 | 0.88 | 0.78 – 0.94 | ±0.080 |
| 10 | ~120 | 0.90 | 0.84 – 0.95 | ±0.055 |
| 30 | ~360 | 0.93 | 0.90 – 0.95 | ±0.027 |
| 60 | ~720 | 0.95 | 0.93 – 0.96 | ±0.017 |
| 120 | ~1,440 | 0.955 | 0.947 – 0.963 | ±0.008 |
| 200 | ~2,400 | 0.955 | 0.949 – 0.961 | ±0.006 |
There are three points to note.
- The point estimate settles
With few samples it swings up and down, but as samples grow it converges toward a stable value. The initial 0.88 and the well-sampled 0.955 are both "the same detector's recall" — but they deserve completely different levels of trust. - The confidence interval tightens
The width keeps shrinking until, eventually, the lower bound of the interval itself crosses the target line. In the table above, the lower bound reaches 0.9 at around 30 documents. - Eventually it plateaus
Between 120 and 200 documents, the point estimate barely moves. That is the signal that "for this domain, we have measured enough." From there, investing in a different domain is the better use of effort.
Our rule: not when the point estimate exceeds 0.9, but when the lower bound of the confidence interval exceeds 0.9 — that is when we say the domain has "achieved 0.9."
It is a conservative criterion, but in the territory of personal information, we believe this degree of caution is exactly right.
9. Common pitfalls
Finally, we share several pitfalls we have actually stumbled into, or see often.
- "Padded" high scores
Evaluation data stacked with near-duplicate answers produces numbers above true ability. An evaluation without diversity is not an evaluation. - Evaluation-data leakage
Use documents from tuning or training in evaluation as well, and you end up grading memorized answers — the numbers detach from reality. - Ground-truth quality
If the human-annotated "ground truth" itself has gaps or inconsistencies, the detector can be counted as "wrong" even when it is right.
Quality control of the yardstick is as important as tuning the detector. - Bias hidden by averages
Even with a high overall average, a specific type of information may be missed badly.Without the habit of breaking results down by type and by domain, you will overlook fatal holes.
10. Summary: honest numbers are what build a product's credibility
We have covered a lot of ground, but the principles we hold ourselves to internally regarding PII detection accuracy boil down to something simple.
- Return to the confusion matrix and be explicit about what was counted as TP/FP/FN.
- Claim only the domains you have measured.
- Always speak with confidence intervals, and judge achievement by the lower bound.
- Do not extrapolate one domain's numbers to another.
More than producing a high number once, being able to show honestly how far that number can be trusted is what ultimately builds a product's credibility.
If you write "recall 0.9," then: on which kinds of documents, counted how, on how much data, and with what interval width was it measured?
Only when you can speak to all of that does the number mean anything.
With this way of thinking, we are steadily building up accuracy, expanding one domain at a time.
It is not flashy — but in a sensitive territory like Japanese-language PII, confidential information, and special-care-required personal data, we believe it is the surest path.
Thank you for reading this far.
See you next time.