The Complete Guide to Subscription Business, Part 2: How a "5% Churn Rate" Erases Half Your Customers in a Year — and the Science of Preventing It

Hello!
This is Qualiteg Consulting!
In Part 1, we covered the basic structure of subscription businesses and the revolutionary concepts of LTV and unit economics. Do you remember the golden rule, "LTV > 3 × CAC"?
 Qualiteg コンサルティング
This time, we finally dive into the metrics that decide the life or death of a subscription business.
The Terrifying Scenario That "Just 5%" Can Cause
First, let me tell you the story of a fictional company.
"Our churn rate is 5% per month. Well, 95% of customers stay, so we should be fine."
So reported the CEO of a SaaS company at a management meeting.
No one saw a problem.
After all, it was just 5%.
But one year later —
the 1,000 customers they had in January had shrunk to 540 by December.
No matter how hard they worked on new acquisition, it was like pouring water into a leaky bucket.
In the end, the money ran out and they were forced to shut the business down.
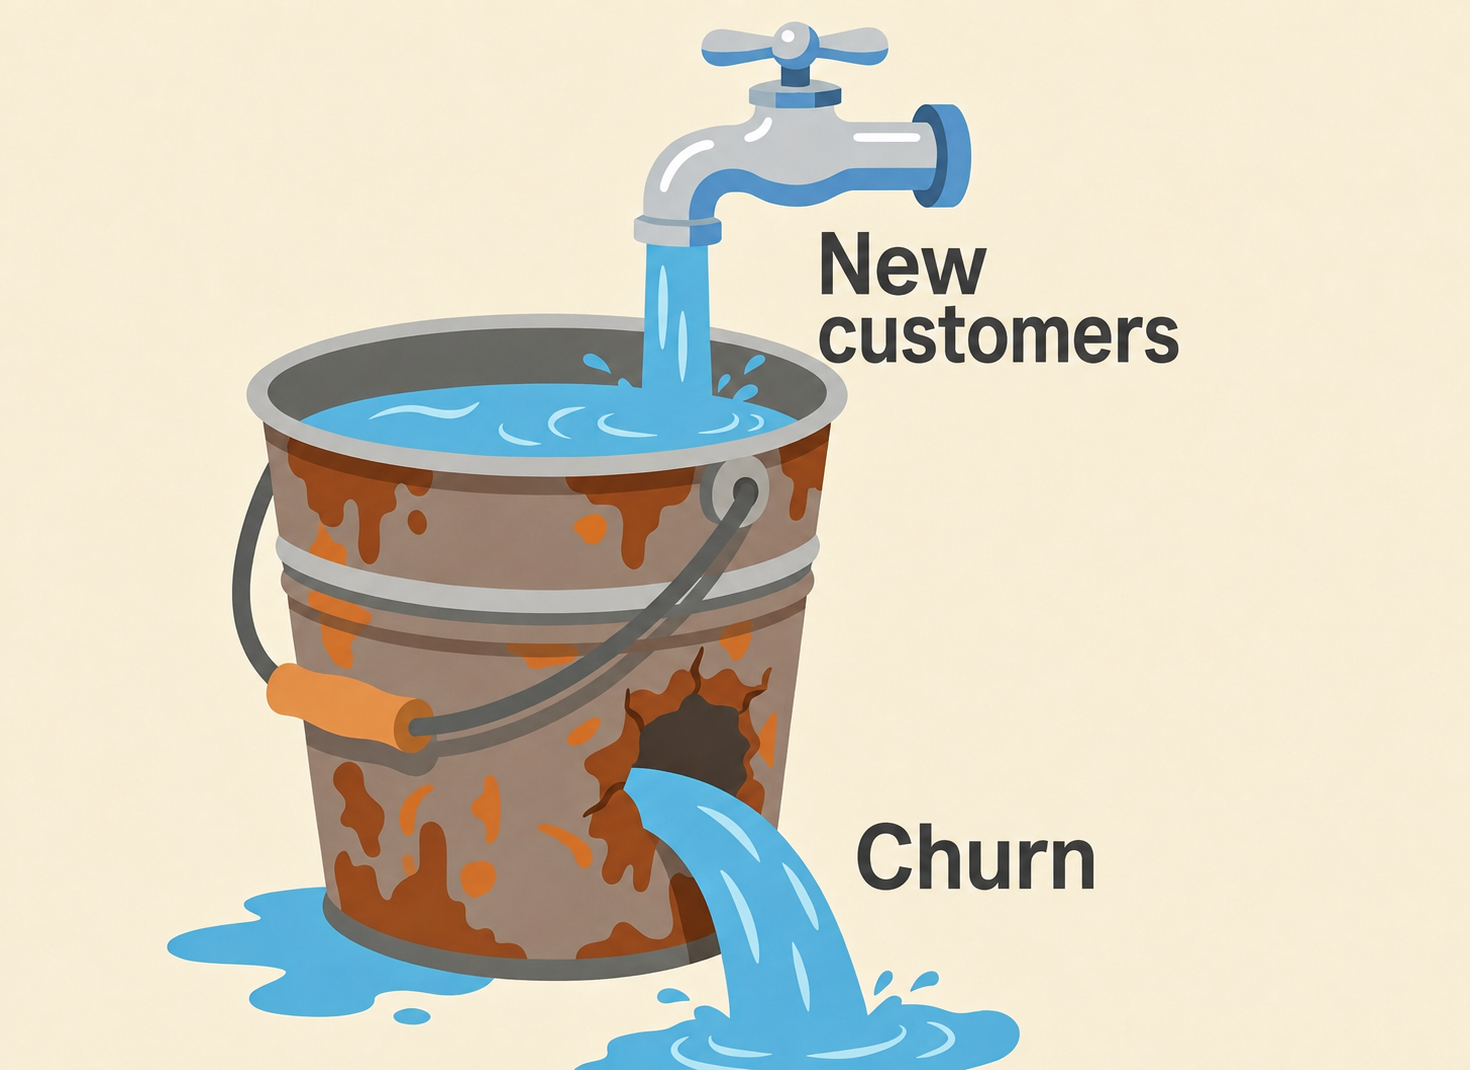
Why did this happen?
The answer lies in the terrifying power of compounding.
If a 5% monthly churn rate continues for a year, the retention rate becomes
0.95 × 0.95 × 0.95 × ... (12 times) = 0.95^12 ≈ 0.54In other words, 46% of your customers disappear.
| Monthly churn rate | Annual retention | Customers after 1 year (starting from 1,000) |
|---|---|---|
| 3% | 69% | 690 |
| 5% | 54% | 540 |
| 7% | 42% | 420 |
| 10% | 28% | 280 |
Look at this table. A difference of just two percentage points in churn rate produces a gap of 150 customers one year later.
This is the terror of churn in a subscription business.
In this installment, we take a thorough look at the metrics and strategies that serve as your weapons against that terror.
Chapter 3: MRR and ARR — Reading Your Business's "Thermometer"
MRR Shows "This Month's Health"
MRR (Monthly Recurring Revenue) is
the revenue you earn on a recurring basis every month
— it matters as the "thermometer" that shows the health of a subscription business.
When you talk to investors, this is the first number they ask about.
"What is your MRR?"
— If you cannot answer that immediately, you can hardly claim to be running a subscription business.
But viewing MRR merely as "this month's revenue" is not enough.
Only by breaking MRR down into its components can you see the true shape of your business.
Decomposing MRR — The Four Components
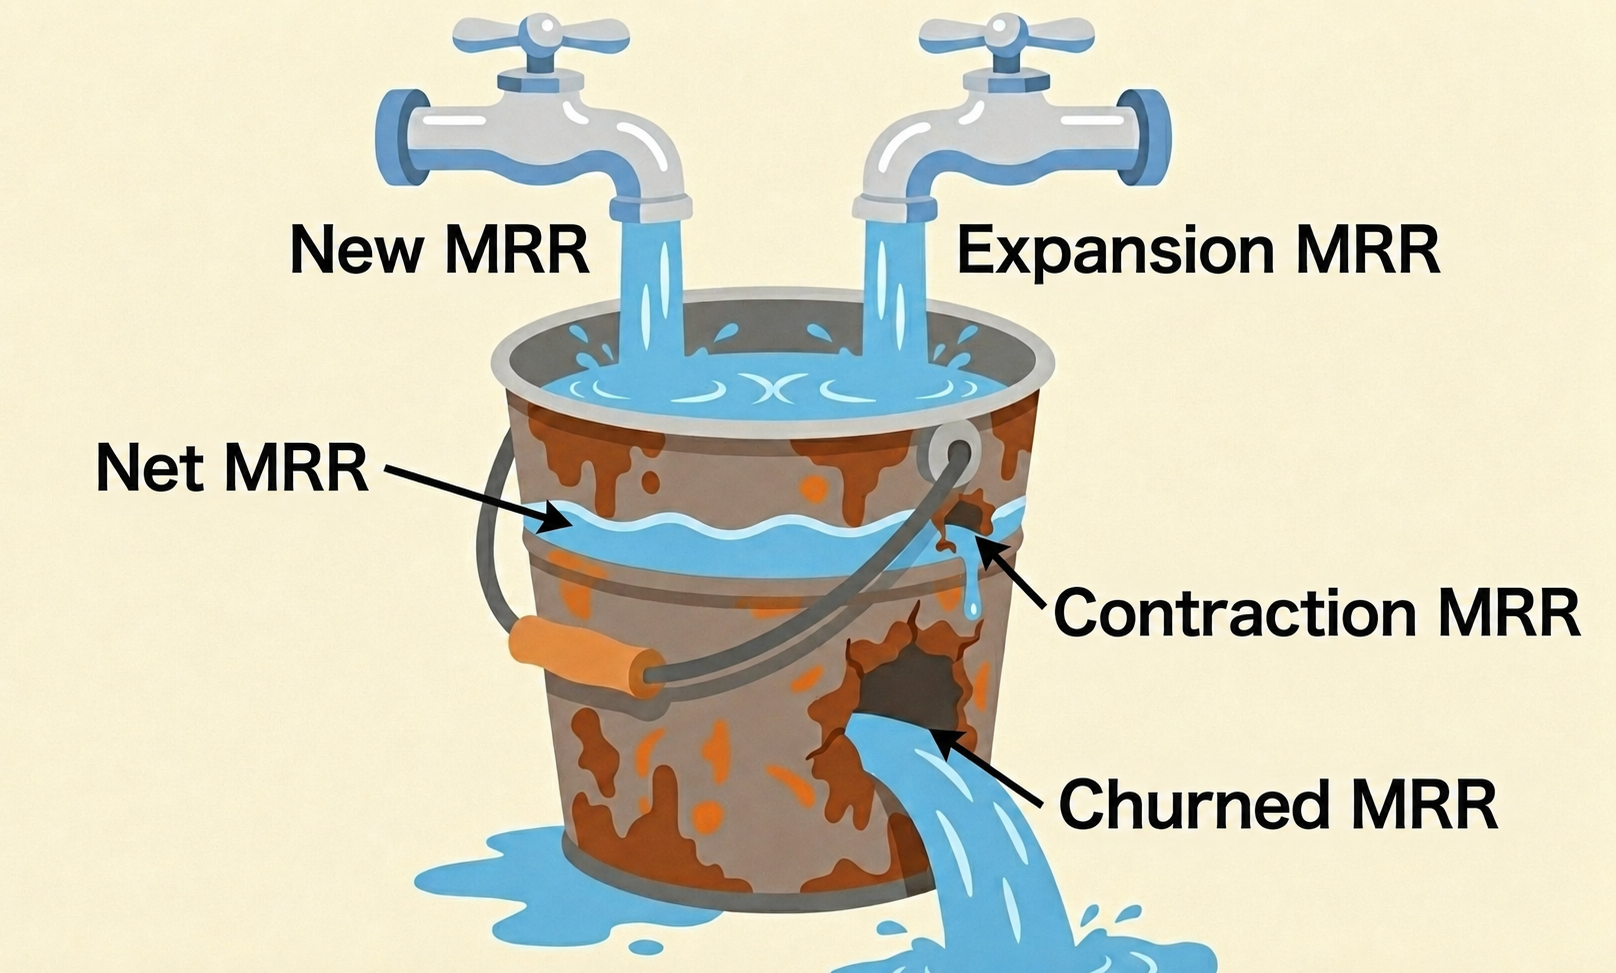
MRR is made up of the following four components.
| Component | Meaning | Example |
|---|---|---|
| New MRR | Revenue from customers newly acquired this month | ¥5,000/month × 20 new customers = ¥100,000 |
| Expansion MRR | Revenue gained from existing customers upgrading | 10 customers move from ¥5,000 to ¥10,000 = +¥50,000 |
| Contraction MRR | Revenue lost from existing customers downgrading | 5 customers move from ¥10,000 to ¥5,000 = -¥25,000 |
| Churned MRR | Revenue lost to customers who cancel | ¥5,000/month × 8 cancellations = -¥40,000 |
The sum of these is Net New MRR.
Net New MRR = New MRR + Expansion MRR - Contraction MRR - Churned MRR
            = ¥100K + ¥50K - ¥25K - ¥40K
            = ¥85K
In this example, monthly recurring revenue grew by ¥85,000 over the previous month.
The Secret of Mature Companies: Expansion Drives Growth
So how do New MRR and Expansion MRR actually relate in practice?
In fact, at mature SaaS companies, it is not unusual for Expansion MRR to exceed New MRR
.
Why?
As we explained in Part 1,
acquiring a new customer costs 5 to 10 times more than upselling an existing one.
It is far more efficient to offer "an even more useful premium plan" to customers who already trust you.
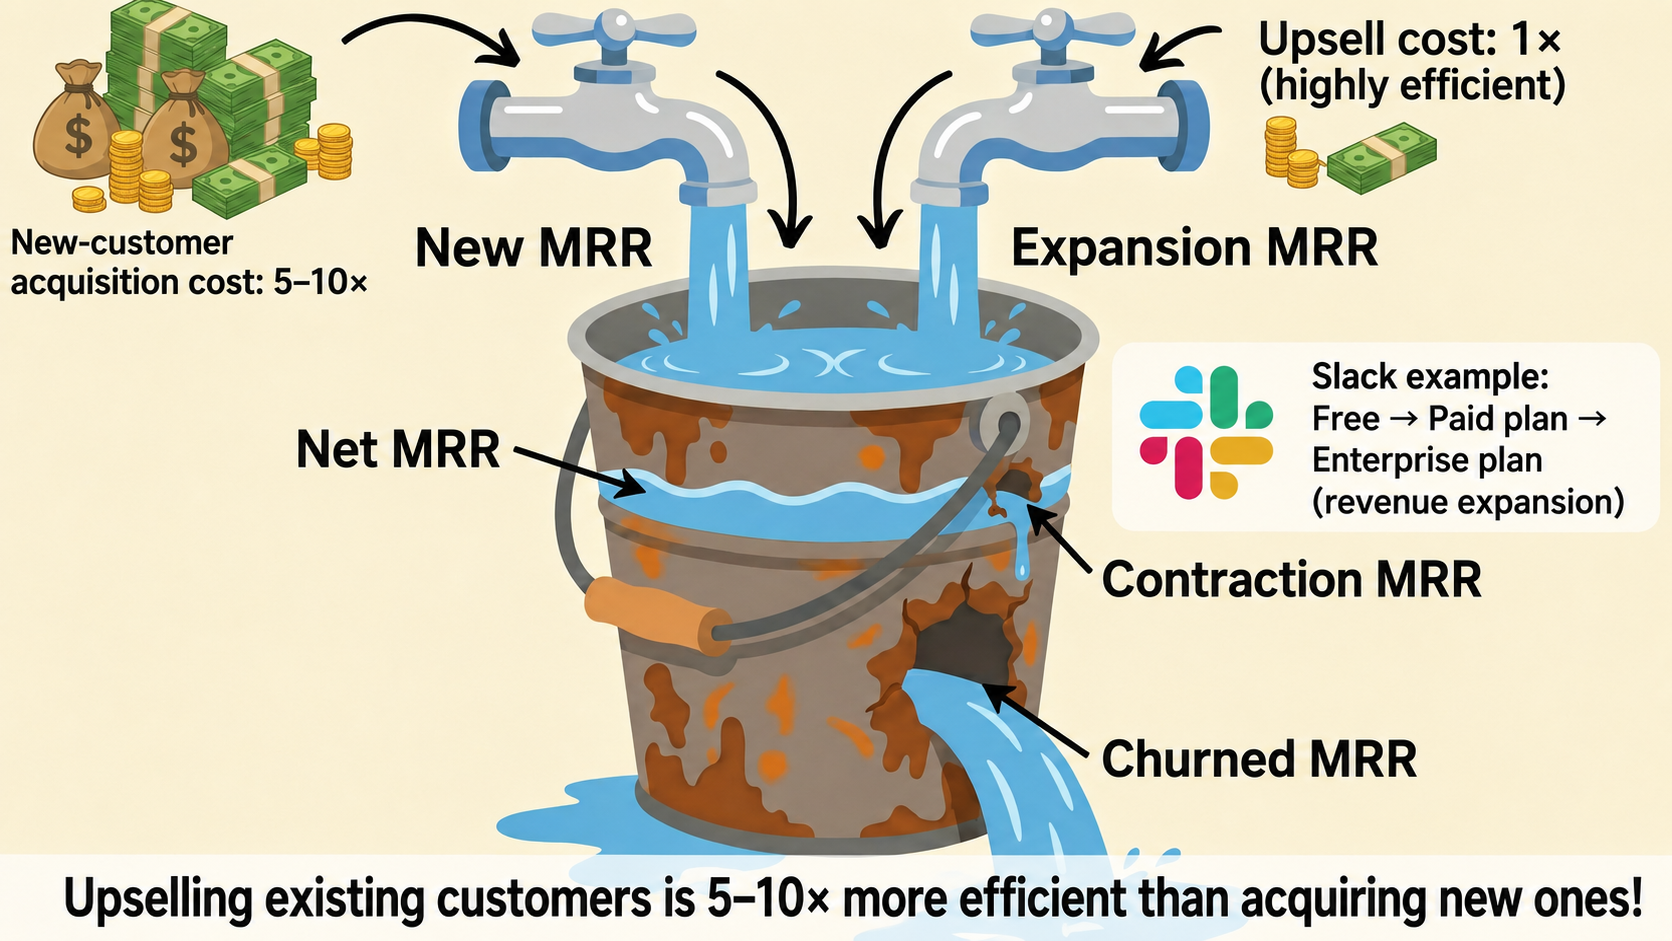
Consider Slack. A team of ten starts on the free plan, realizes how useful it is, and upgrades to a paid plan. Adoption then spreads across the whole company, and eventually to the enterprise plan.
Whether you can build a structure where revenue from a single customer (a single company) grows over time is what separates the winners from the losers in subscription business.
ARR = MRR × 12: Why Bother Annualizing?
ARR (Annual Recurring Revenue) is simply MRR multiplied by 12.
ARR = the revenue you earn on a recurring basis every year
You might wonder, "Why redefine something that is just MRR times 12?"
There are two reasons.
- It is convenient for valuing a company
Investors often value companies as a multiple of ARR. MRR numbers are too small to compare easily. - The psychological milestone of "¥100 million ARR"
Cross this line and you are recognized as a "proper SaaS company."
In hiring and in fundraising alike, this number becomes a form of credibility.
To sum up:
when the recurring revenue of your subscription business reaches ¥8.33 million per month, you hit the milestone that earns you recognition as a proper SaaS company — ¥100 million in ARR.
| MRR | ARR | Approximate stage |
|---|---|---|
| ¥1M | ¥12M | Searching for PMF (product-market fit) |
| ¥5M | ¥60M | Early growth phase |
| ¥8.33M | ¥100M | 🎉 Joining the ranks of proper SaaS companies |
| ¥25M | ¥300M | Scale phase |
Chapter 4: The Never-Ending Battle Against Churn
Using the Two Kinds of Churn Rate
There are actually two kinds of churn rate. Confuse them, and you will misread the true state of your business.
| Metric | How to calculate | What it tells you |
|---|---|---|
| Customer Churn Rate | Customers lost ÷ customers at start of month | The decline in customer headcount |
| Revenue Churn Rate | Churned MRR ÷ MRR at start of month | The actual impact on revenue |
Why do we need both? Because
different customers pay different amounts.
50 customers paying ¥1,000/month cancel → 5% customer churn, ¥50,000 in lost revenue
1 customer paying ¥100,000/month cancels → 0.1% customer churn, ¥100,000 in lost revenue
By headcount it is 50 to 1, but the revenue impact of the latter is twice as large.
That is why you need to monitor from both perspectives.
B2B vs. B2C: "Healthy" Differs by Industry
"Our churn rate is 5%. Is that good or bad?"
It is a common question, and the answer is: it depends on the industry.
| B2B SaaS | B2C subscription | |
|---|---|---|
| 🟢 Excellent | 1–2% | 3–5% |
| 🟡 Average | 3–5% | 5–10% |
| 🔴 Needs improvement | 5%+ | 10%+ |
Why is churn lower in B2B?
- Replacing a system once deployed is painful (switching costs)
- Multiple people use it, so the decision to cancel takes time
- Annual contracts are common, making mid-term cancellation hard
Conversely, if a B2C subscription achieves 3% monthly churn, that is quite impressive.
The Magical State Called "Negative Churn"
Now let me show you the ultimate ideal in subscription business.
It is negative churn (negative revenue churn).
Normally, since customers keep canceling, revenue churn is positive (i.e., revenue shrinks).
But imagine this situation:
This month, 5% of customers cancel (a ¥50,000 loss)But upsells to the remaining customers add ¥100,000 in revenueOn balance, growth outpaces cancellations
This is "negative churn."
Without acquiring a single new customer, you can grow on existing customers alone — a dream-like state.
Revenue Churn = (loss from cancellations - gains from upsells) ÷ MRR at start of month
             = (¥50K - ¥100K) ÷ ¥1,000K
             = -5%  ← negative!
Many fast-growing SaaS companies, such as Slack and Zoom, achieved this negative churn.
| State | Revenue churn | Meaning |
|---|---|---|
| Normal | +3% | Revenue erodes 3% every month |
| Low churn | +1% | Excellent, but still shrinking |
| Negative churn | -5% | 🎉 Growing faster than churn! |
Chapter 5: The First 30 Days — Where the Battle Is Decided
Why the "First 30 Days" Matter
Here is a striking piece of data.
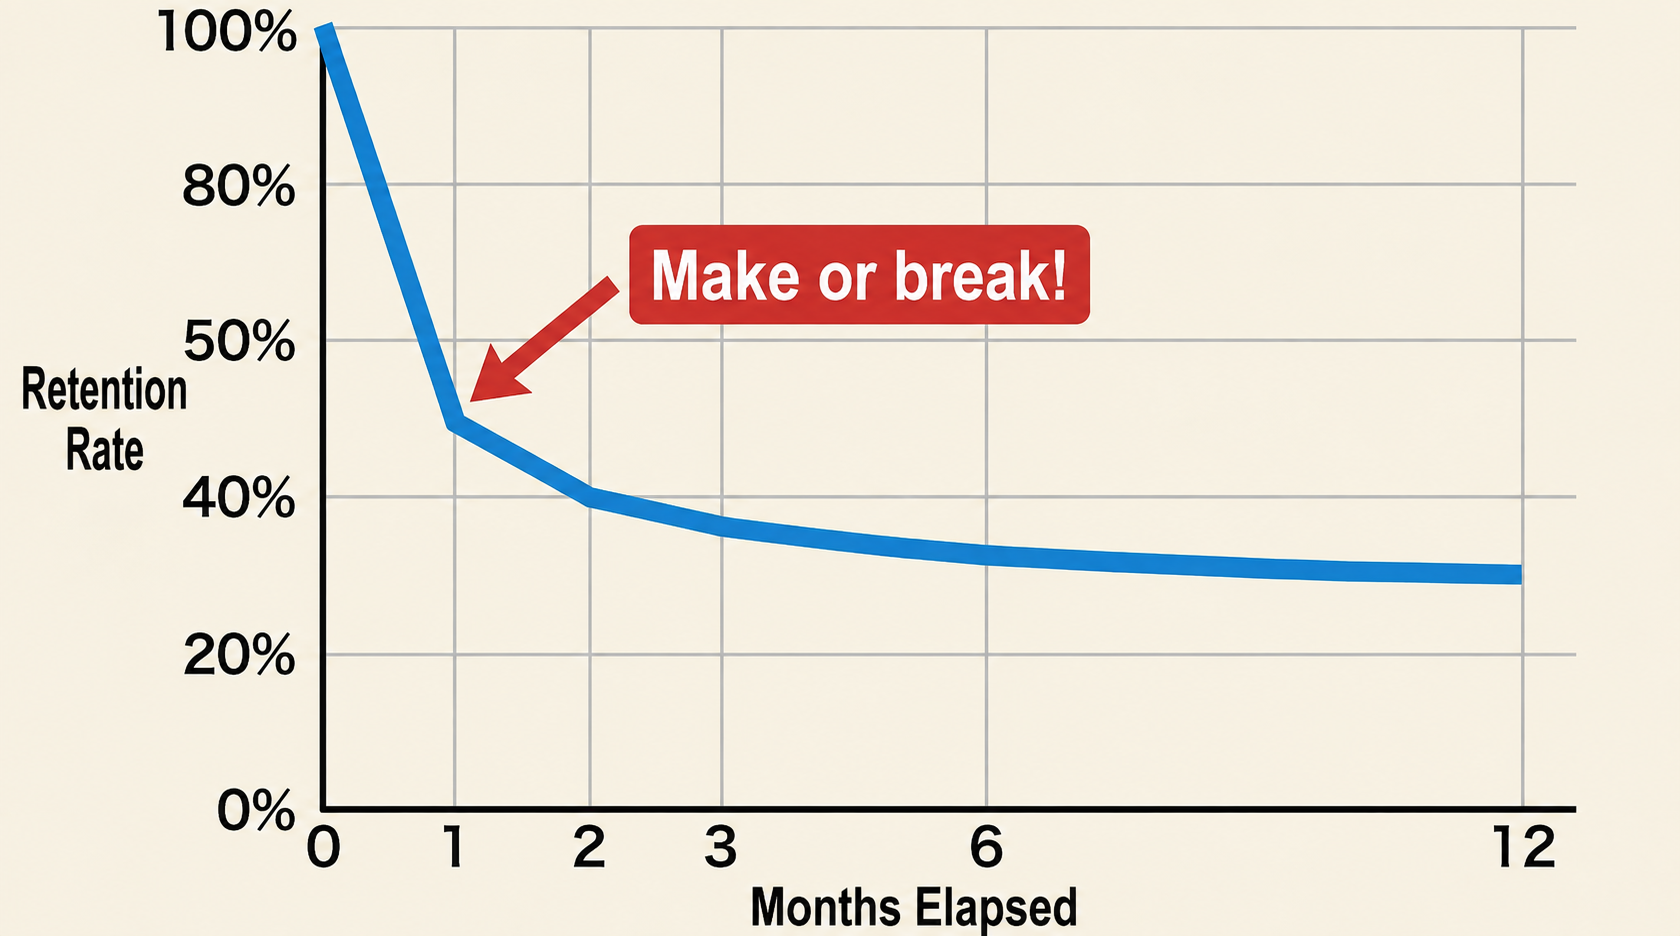
40–60% of all cancellations happen within the first 30 days
In other words, if customers feel "this is useful!" within the first 30 days, you win.
So how do you get customers to feel the value quickly? Slack has proven the answer.
The "3-Minute Rule" Slack Proved
Let us look at Slack, often called the gold standard of onboarding.
Slack is designed so that users reach its core value in just three minutes.
| Step | Time | What you do |
|---|---|---|
| 1. Create an account | 30 sec | Just an email and password |
| 2. Set the team name | 10 sec | Just enter your company name |
| 3. Create the first channel | 30 sec | "#general" is created automatically |
| 4. Invite team members | 1 min | Enter their email addresses |
| 5. Send the first message | 30 sec | 🎉 Feel the value! |
In under three minutes total, the user experiences that "hey, this might be useful" moment.
Why does this speed matter?
Research shows that
with online services, if it takes more than 5 minutes to feel the value, over 50% of people drop off
. Past 10 minutes, 80% drop off.
Human attention has its limits.
Finding the "Magic Moment" Scientifically
Every service has a magic moment — the moment customers feel "oh, this is good!"
And customers who reach that moment have overwhelmingly higher retention than those who do not.
Let us look at some famous examples.
| Service | Magic moment (activation metric) | How it was found |
|---|---|---|
| X | Follow 5 or more accounts | Correlation analysis with retention |
| Dropbox | Complete the first file sync | Behavioral data analysis |
| Zoom | Complete the first video meeting | Cohort analysis |
| Make 7 friends within 10 days | Research by the early growth team |
The example of X (formerly Twitter) is especially interesting.
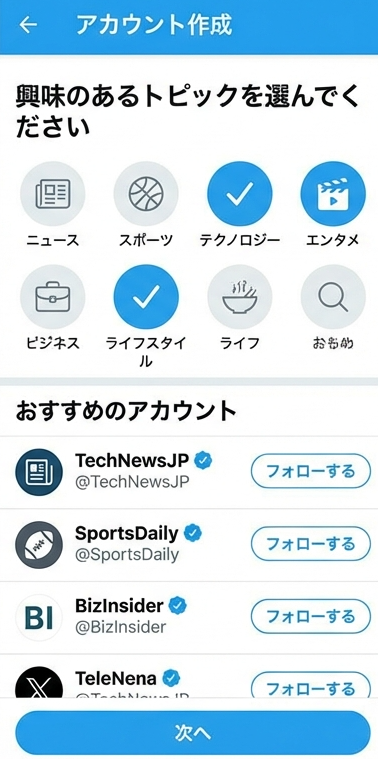
Their research found that people who followed five or more accounts had overwhelmingly higher retention. Why?
X's value lies in the information flowing through your timeline. If you follow no one, your timeline is empty — and you feel no value.
Follow five accounts, and information starts flowing into your timeline: "oh, this is interesting." That is why X thoroughly designed its onboarding to make sure new users follow at least five accounts.
- Have users pick topics they are interested in
- Show popular accounts for those topics
- Actively suggest "recommended users"
All of it exists to lead users to the magic moment of "following five accounts."
Improve CVR, and CAC Drops Dramatically
CVR (Conversion Rate) is the percentage of people who move from one action to the next.
If 2 out of 100 site visitors become paying members, your CVR is 2%.
Improving CVR is the most effective way to dramatically lower CAC.
CAC: Customer Acquisition Cost
Let us look at a concrete example.
| CVR | Customers acquired with ¥1M in ad spend | CAC |
|---|---|---|
| 1% | 100 | ¥10,000 |
| 2% | 200 | ¥5,000 |
| 3% | 300 | ¥3,333 |
Double your CVR, and your CAC halves.
In many cases, improving CVR is more efficient than increasing ad spend.
There is a caveat, however.
Push CVR too high, and low-quality customers increase
Run a campaign like "¥10,000 just for signing up!" and your CVR will spike. But you end up with customers who are only in it for the money, and they cancel quickly.
CVR improvement that ignores LTV is meaningless.Raising the CVR of high-quality customers is what matters.
LTV (Life Time Value): the total revenue a single customer brings to the company from first use until cancellation
Chapter 6: Customer Success — From "Support" to "Offense"
Fundamentally Different from Customer Support
Customer success — have you heard the term?
If you think it is just another name for customer support, that is a misconception.
| Customer support | Customer success | |
|---|---|---|
| Posture | Reactive (responds when problems occur) | Proactive (prevents problems before they occur) |
| Goal | Resolve inquiries | Help customers achieve their business goals |
| Metrics | Response time, resolution rate | Retention, NPS, upsell rate |
| Timing | When the customer reaches out | Ahead of the customer, based on behavioral data |
Customer support is the firefighter: when a fire breaks out, they go put it out.
Customer success is preventive medicine: run the checkups, and act before the illness develops.
Predicting Churn with a "Health Score"
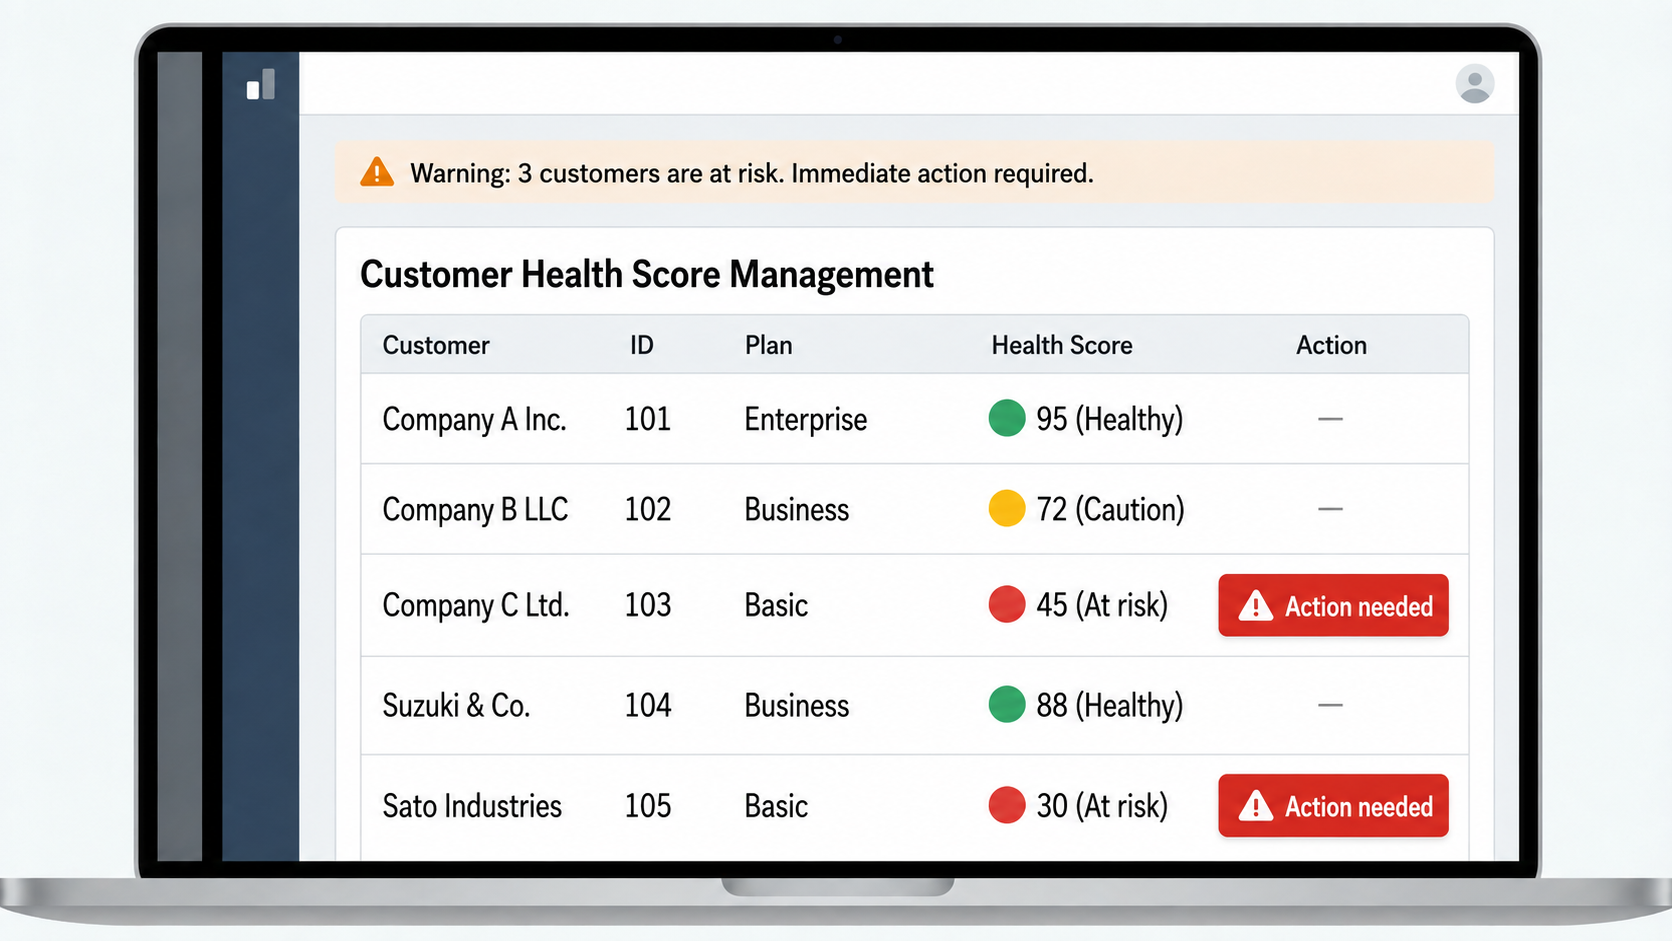
The heart of customer success is continuously monitoring each customer's health score.
You analyze data like the following holistically and quantify each customer's "state of health."
| Data item | Healthy sign | Warning sign |
|---|---|---|
| Login frequency | Daily to several times a week | No login for 2+ weeks |
| Feature usage | Actively uses core features | Uses only basic features |
| Support inquiries | Few, or positive questions | Frequent complaints |
| NPS (likelihood to recommend) | 9–10 | 0–6 |
For customers whose score is dropping, you reach out proactively.
"We noticed you haven't logged in recently — is there anything we can help with?"
When you get in touch, you often uncover issues like "the person in charge changed and nothing was handed over" or "we couldn't figure out how to use the new feature."
Act before the problem surfaces in the form of a cancellation.
That is the essence of customer success.
[From the Field] How Onboarding Improvements Cut Churn in Half
Here is a case study from a B2B SaaS company.
This company's monthly churn rate was stuck at a high 7–8% — "no matter how many new customers we acquire, the hole never closes."
Analysis revealed that about 65% of cancellations occurred within the first 45 days. The causes: complicated initial setup, and too long a wait before feeling the value.
So they implemented the following measures:
- Cut initial setup steps from 12 items to 5
- Customer success calls every new customer within 3 days of signup
- Turned the guide to the "first success experience" into videos
As a result, monthly churn improved to 3–4% within six months. LTV rose by about 1.8x, and unit economics improved substantially.
The key was focusing not on adding features, but on polishing the first experience. The battle was about delivering the "magic moment" from Chapter 5 as quickly and reliably as possible.
Customer Success as the Starting Point for Upsells
Customer success is not just about preventing churn — it is also the starting point for upsells and cross-sells.
When you watch how customers use your product, upsell opportunities surface naturally:
- "They are nearing their storage limit → propose the higher plan"
- "They use this feature heavily → they might be interested in a related product"
- "Their team is growing → introduce the enterprise plan"
When framed not as a hard sell but as a proposal for the customer's success, close rates improve dramatically.
Summary: Key Points from Part 2
So, how was this installment?
Let us organize what we have learned.
| Metric / concept | In one line | Numbers to remember |
|---|---|---|
| MRR | Monthly recurring revenue (the thermometer) | Decompose into New / Expansion / Contraction / Churned |
| ARR | MRR × 12 (annualized) | ¥100M is a key milestone |
| Churn rate | The rate of cancellations | B2B: 1–2% is excellent; B2C: 3–5% is excellent |
| Negative churn | Growth that outpaces cancellations | The ultimate ideal |
| Onboarding | The first-use experience | The battle is decided in the first 30 days |
| Magic moment | The instant users feel "this is good!" | Twitter: follow 5 accounts; Dropbox: first sync |
| Customer success | Customer support on offense | Get ahead of churn with health scores |
Coming Up Next
In Part 3, we will cover choosing a growth strategy and the cash flow trap!
PLG vs. SLG — which one is your business?
The cash flow trap that startups fall into
A data-driven approach to improvement
"The more we grow, the more we somehow run out of cash" — we will get to the bottom of this paradox and its solutions.
About Us
Thank you very much for reading to the end.
We at Qualiteg provide training and consulting on business transformation and new business planning (including subscription businesses and SaaS), with strategy consultants from global consulting firms on our team. We also offer practical support, backed by extensive experience and results, in new business development for the AI era, business strategy, and digital transformation.
If you are interested, or have a specific request, please feel free to contact us via the inquiry form here.
See you next time!