
The Complete Guide to Subscription Business, Part 3: Designing for Growth


Hello, this is Qualiteg Consulting!
Welcome to Part 3 of our Complete Guide to Subscription Business!
This time we cover PLG, SLG, unit economics, and the practical side of data-driven improvement.
What you'll learn in this article
- The differences between PLG, SLG, and land-and-expand, and when to use each
- How to read the key metrics in practice: NRR, LTV/CAC, payback period, and more
- How to gauge cash-flow risk from burn rate and runway
- How to drive improvement with funnel analysis, cohort analysis, and A/B testing
- The cost structure peculiar to AI products and what it means for unit economics
The Complete Subscription Business Series
Part 1: Never Be Lost Again When Someone Says "Our ARR..." or "Our Churn..."
 Qualiteg コンサルティング
Part 2: How a "5% Churn Rate" Erases Half Your Customers in a Year — and the Science of Preventing It
Qualiteg コンサルティング
In the previous installments, we covered the fundamentals of subscription business (LTV, CAC, unit economics), customer acquisition (paid advertising and organic traffic), and the key metrics (MRR, churn rate, CVR, ARPU).
In Part 3, we focus on the phase after you have actually acquired customers: growing them and improving based on data. Understanding the metrics is not enough — what matters is how you turn them into management decisions. In the generative-AI product space especially, on top of the usual SaaS metric literacy, you have to design around AI-specific cost structures and the difficulty of embedding the product into customers' daily work. We weave those perspectives in throughout.
Chapter 5: Choosing a Growth Strategy
— PLG, SLG, and the Blended Approach —
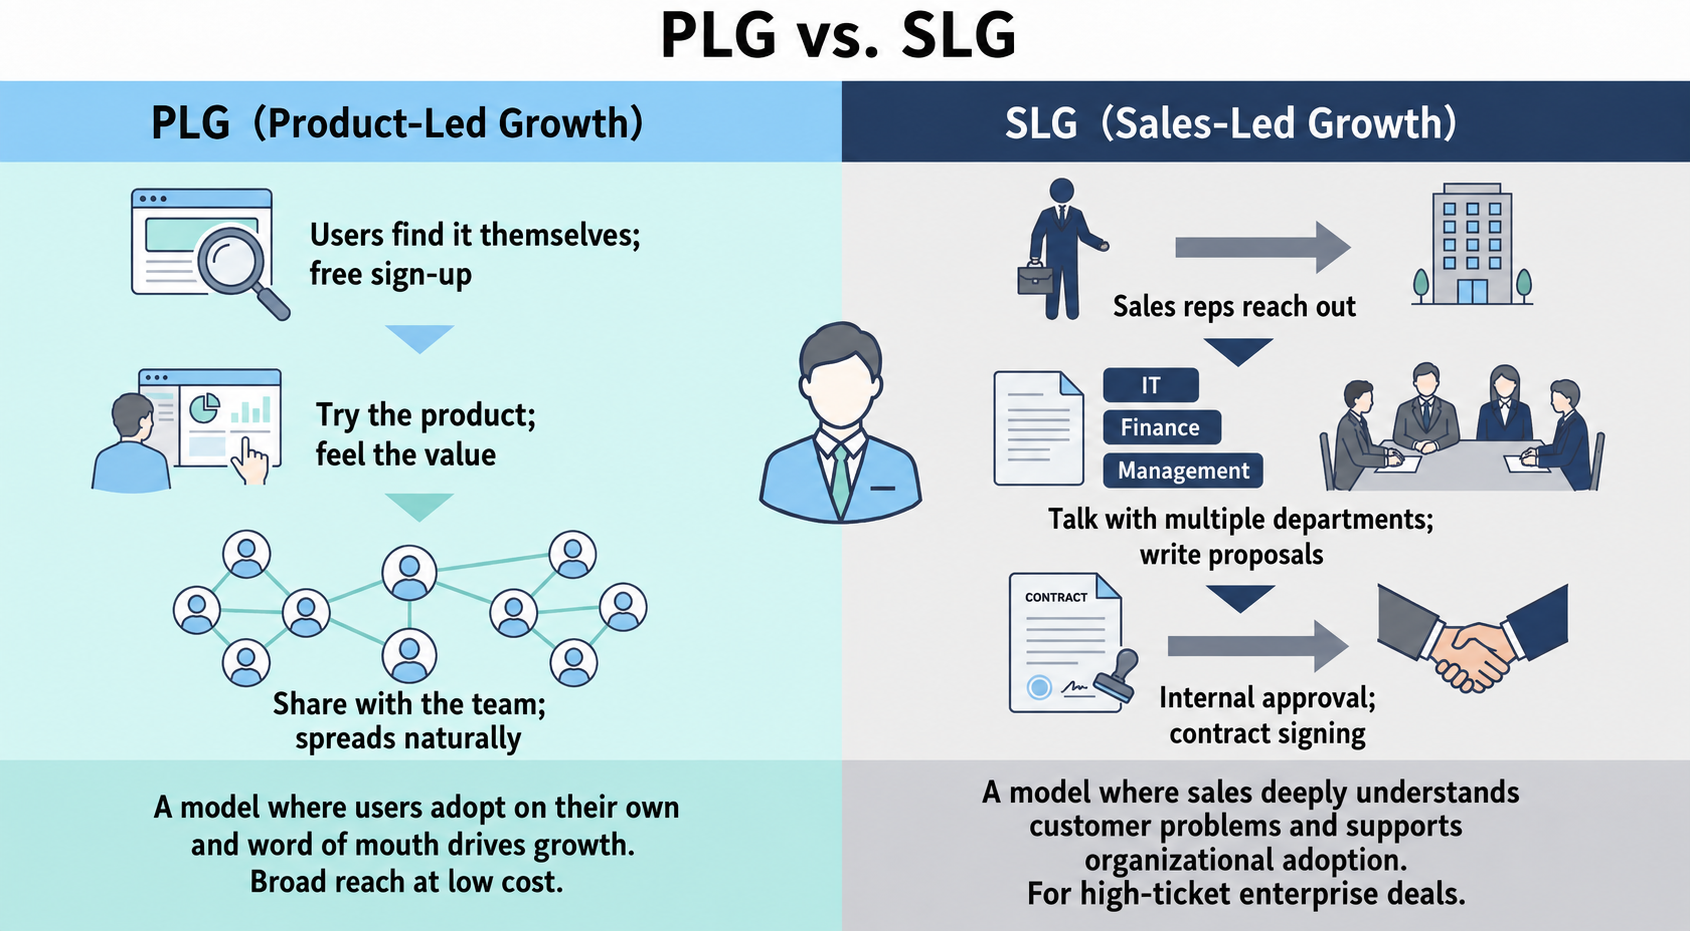
PLG (Product-Led Growth): Growing on the Strength of the Product
PLG (Product-Led Growth) is a strategy in which the product itself — rather than sales or marketing — drives growth. Many of the fastest-growing SaaS companies of recent years follow this playbook, with plenty of success stories in areas like communication tools, video conferencing, and document collaboration.
PLG's defining trait is that customers find the service themselves, try it, experience its value, and proceed to purchase — registering a credit card and getting started without ever speaking to a salesperson. This dramatically reduces customer acquisition costs. Not only do you save on sales headcount; customers can evaluate at their own pace, which makes for a better buying experience.
Several conditions must hold for PLG to succeed. First, the product must be intuitive and easy to use — people should figure it out by playing with it, without reading a manual. Even feature-rich tools need templates and a clear starting screen so that beginners can get going immediately.
Second, the product must deliver value even to a single user. It should be worthwhile used alone at first, and then generate far more value as team members are invited. Designing for "start small, grow big" is essential.
A built-in word-of-mouth loop is another key PLG ingredient. With video conferencing tools, for example, letting meeting participants join without creating an account means invitees think "this is handy" and start using it themselves — a virtuous cycle.
PLG typically pairs with either a freemium model or a free trial. Freemium offers core features free forever, charging for advanced capabilities. A free trial offers the full feature set for a limited period (usually 14 or 30 days). Which to choose depends on the product's nature and target customers.
SLG (Sales-Led Growth): Growing on the Strength of Sales
SLG (Sales-Led Growth) is the traditional strategy in which a sales team leads customer acquisition. Most enterprise-focused SaaS companies follow it.
SLG fits when price points are relatively high and the purchase decision requires explanation and coordination. For B2B services costing tens of thousands to hundreds of thousands of yen per month, decisions are typically made only after evaluating ROI, security, integration with existing systems, and operational readiness. That process depends on humans explaining and persuading.
SLG is also effective when multiple stakeholders are involved in the decision. In large companies you must bring along the hands-on users, the IT department, procurement, and the final approver. Addressing each party's interests and concerns and getting everyone to yes takes a salesperson's orchestration skills.
A typical SLG sales process flows like this. Marketing generates MQLs (Marketing Qualified Leads — prospects acquired through marketing programs), triggered by whitepaper downloads, webinar attendance, demo requests, and so on. Inside sales then evaluates the MQLs, promoting the promising ones to SQLs (Sales Qualified Leads — prospects worth active sales attention). Finally, field sales runs demos, proposals, and negotiations with the SQLs and closes the deal.
What matters in SLG is measuring sales efficiency. One such metric is the "magic number": new ARR for the quarter divided by the previous quarter's sales and marketing spend. (Benchmarks for this metric vary by company and industry, so it is best interpreted against your own business.) For example, if you invested ¥100 million in sales and marketing last quarter and won ¥80 million in new ARR this quarter, the magic number is 0.8.
Land and Expand: Start Small, Grow Big
Land and expand combines the best of PLG and SLG: begin with a small contract and grow it step by step.
The typical scenario goes like this. First, one department or a small team pilots the product — a small contract of around ¥50,000 a month. At this stage approvals are light and rollout is fast. A few months in, results start showing, and other departments take notice: "that tool the sales team uses — could marketing use it too?" Six months later a company-wide rollout is on the table and the contract grows to ¥1,000,000 a month. A year on, it may extend to group companies and reach the ¥5,000,000-a-month scale.
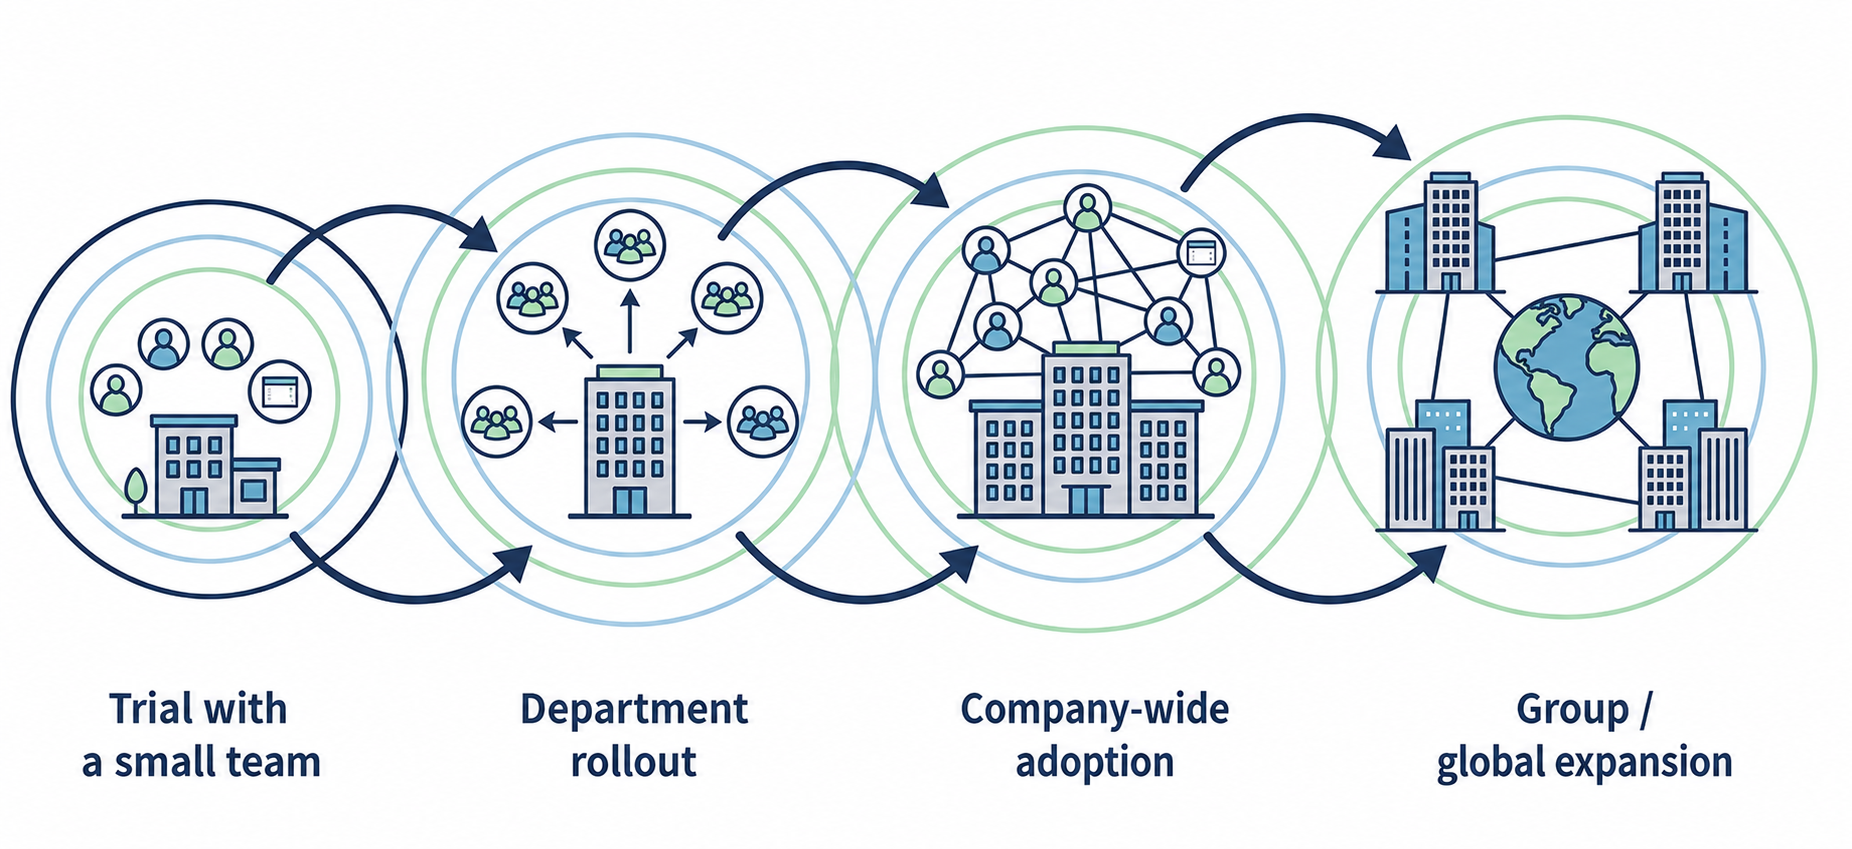
The strategy's advantage is that it limits the customer's adoption risk. Starting with a small pilot contains the blast radius of failure far better than a company-wide rollout from day one. And because the customer expands only after experiencing real value, the odds of a successful rollout are higher.
For land and expand to work, the first success story is decisive. Deliver unmistakable results in the first department and create an internal success story. That requires the customer success team to support proactively and supply best practices.
Product design matters too. You need the scalability to start small yet handle large deployments: performance that holds up as users grow from 10 to 1,000, per-department permission management, and integration with other systems — the capabilities that enterprise adoption demands.
NRR (Net Revenue Retention): Measuring Growth from Existing Customers
NRR (Net Revenue Retention) shows how well revenue from existing customers is retained and grown. Excluding new customers, it measures how much you can grow on your existing base alone.
Let's walk through the calculation. Say monthly revenue from existing customers at the start of the period (January 2024) was ¥10 million. A year later (January 2025), you measure revenue from that same customer group. Some churned, some downgraded, but many upgraded. If the result is ¥11.5 million, NRR is 115%.
NRR above 100% means you can grow without acquiring a single new customer — on the existing base alone. It is one of the metrics investors watch most closely, and top-tier SaaS companies have been reported to reach NRR around 120% (specific benchmarks vary by industry and company size).
There are several ways to raise NRR. First, reduce churn — fewer cancellations directly lift NRR. Second, increase upsells: analyze usage and propose higher tiers at the right moment. Third, grow revenue through cross-sells: get customers to add related products and add-on features.
Companies with high NRR share one trait: a genuine commitment to their customers' success. When customers hit their business goals and grow, usage naturally grows with them. When a customer's business stalls, the service becomes dispensable. That is exactly why customer success matters.
Chapter 5 Wrap-Up — The Practical Decision Axis
We have covered PLG, SLG, land and expand, and NRR — but the point is not to treat PLG vs. SLG as a binary choice. In B2B SaaS and AI products especially, even when the first touch is product-led, serious adoption requires security reviews, permission design, integration with existing workflows, and an ROI story. In other words, a growth strategy must be designed to cover not just "how you sell" but "the structure by which value takes root after adoption."
For generative-AI products in particular, even as you make self-service trial easy, production use demands support in areas like prompt design, data integration, output quality monitoring, and governance. The key to growing NRR likewise lies less in shipping new features than in how deeply the product embeds into the customer's workflow. Qualiteg supports this "from adoption to entrenchment" design work, hand in hand with product design itself.
Chapter 6: Avoiding the Cash-Flow Trap
— Financing and Unit Economics —
Burn Rate and Runway: Knowing How Long You Can Survive
For a startup, cash is the lifeline of the business. However bright the future, the business ends when the cash runs out. Burn rate measures how much cash you consume each month; runway tells you how many months you can keep operating at the current pace.
There are two kinds of burn: gross burn and net burn. Gross burn is total monthly spending — office rent, payroll, server costs, marketing, everything. If monthly spending is ¥5 million, the gross burn rate is ¥5 million.
Net burn is total spending minus revenue. If monthly spending is ¥5 million but revenue is ¥2 million, the net burn rate is ¥3 million. That is the amount of cash actually draining away.
Runway is cash on hand divided by the net burn rate. With ¥30 million in the bank and a ¥3 million net burn, runway is 10 months — meaning at the current pace, the money runs out in 10 months.
The rule of thumb is that startups should always maintain 12–18 months of runway. Fundraising typically takes 3–6 months, so starting the process only after runway drops below 6 months is likely too late. A short runway also weakens your negotiating position, forcing you to accept unfavorable terms.
Payback Period: The Time Axis of Recouping Your Investment
The payback period is the time it takes to recoup customer acquisition cost (CAC). It is a critically important metric for understanding subscription cash flow.
The calculation is simple: divide CAC by monthly gross profit. For example, with a CAC of ¥30,000, monthly ARPU of ¥5,000, and a 60% gross margin, monthly gross profit is ¥3,000. Payback period is ¥30,000 ÷ ¥3,000 = 10 months.
Why gross profit? Because revenue minus direct costs (servers, payment processing fees, and for AI products, inference costs) is the money that actually stays with you. On ¥5,000 of revenue, if costs are ¥2,000, only ¥3,000 remains.
The payback period matters because it maps directly onto cash flow. A 12-month payback means the investment in each customer stays unrecouped for a full year after acquisition. Acquire 100 customers and you carry 100 customers' worth of unrecovered cost for a year. The faster you grow, the more cash you need.
As industry benchmarks go, B2B SaaS commonly treats a payback within 12 months as the yardstick, 6–9 months as healthy, and under 6 months as highly efficient (specifics vary by business model and customer segment). For B2C the yardstick is shorter still, at 3–6 months. B2C paybacks need to be shorter because churn is relatively higher, making long recovery horizons riskier.
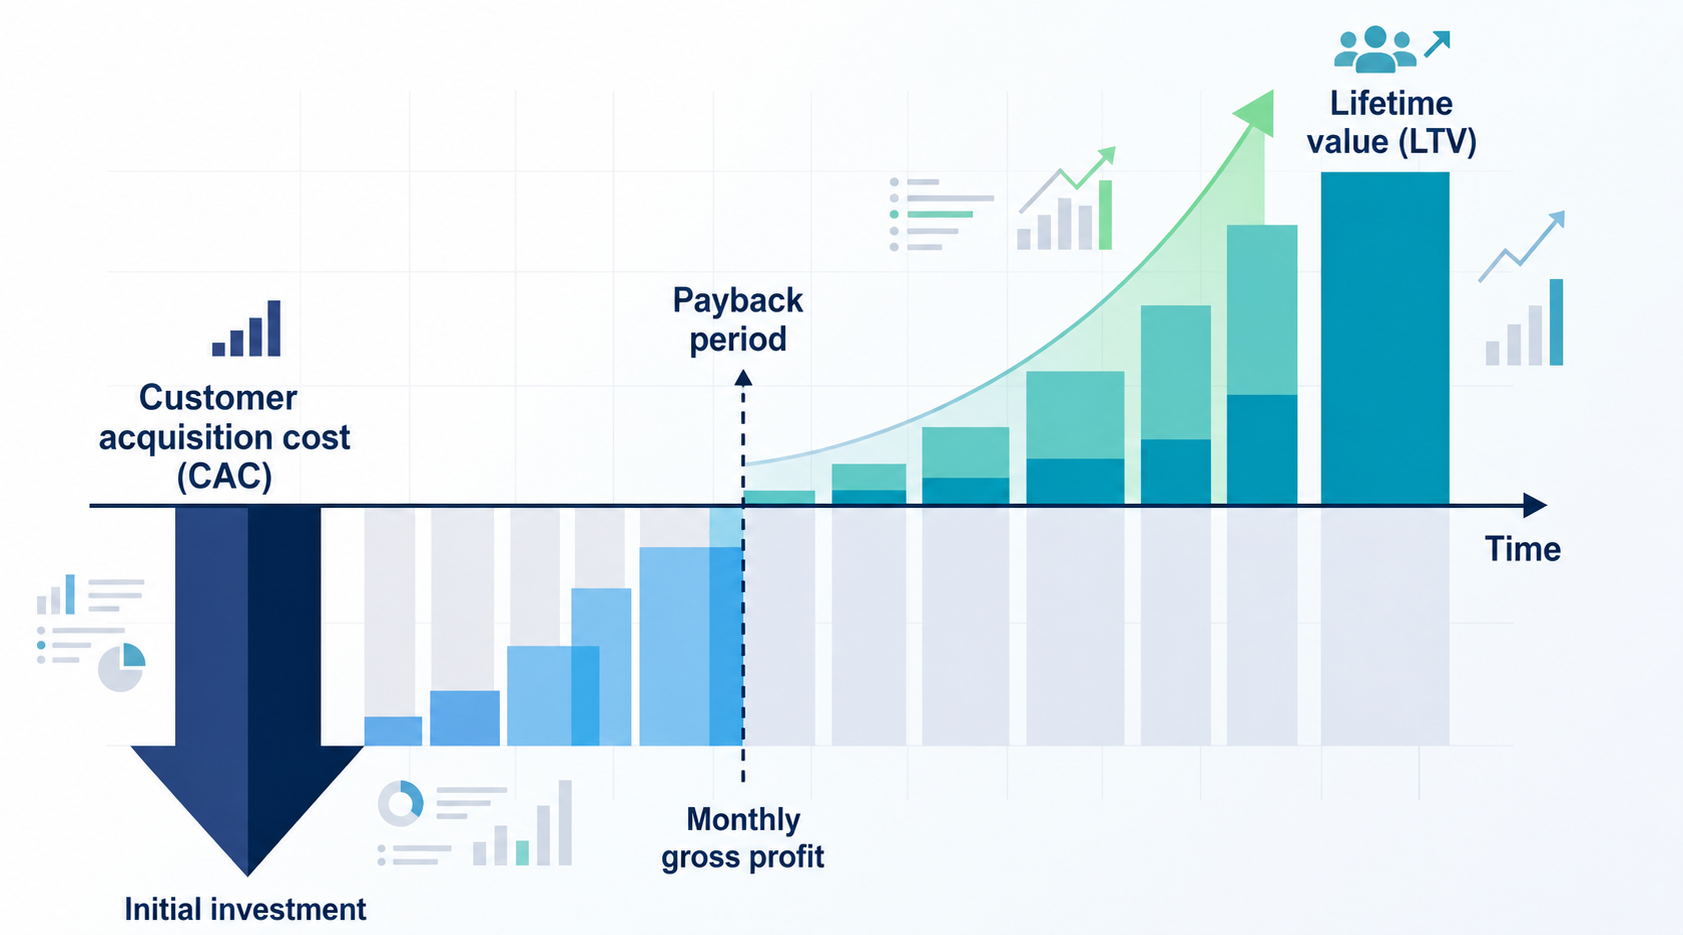
There are several ways to shorten the payback period: lower CAC (more efficient advertising, more organic traffic), raise ARPU (repricing, upsells), and improve gross margin (cost reduction, efficiency). Annual contracts paid up front also improve cash flow dramatically.
Rule of 40: Balancing Growth and Profitability
The Rule of 40 is the heuristic that growth rate plus profit margin should total at least 40%. For example, 60% annual growth with a -20% margin sums to 40%; 30% growth with a 15% margin sums to 45%.
The metric grew out of the SaaS dilemma: chase high growth and you run losses; rush to profitability and growth stalls. Which to prioritize keeps many executives up at night. The Rule of 40 is a simple, practical gauge of the balance between the two.
At early stages, prioritizing growth over profitability can be the right call. If you can sustain high growth, it may make sense to tolerate a certain level of losses while capturing market share. That said, how this is judged shifts substantially with the fundraising climate and investor sentiment, so the Rule of 40 should be treated as one reference point among several. As an IPO comes into view, more balanced numbers tend to be expected — for instance, 40% annual growth with a 10% margin (a total of 50%).
How to improve the Rule of 40 depends on your stage. High-growth but loss-making companies should focus on improving unit economics: raise LTV/CAC above 3x and shorten the payback period. Profitable but slow-growing companies need new growth drivers: new markets, new products, or M&A.
LTV > 3 × CAC: Using the Golden Rule Correctly
The golden rule that LTV (customer lifetime value) should be at least 3x CAC (customer acquisition cost) is the single most important gauge of a subscription business's health. Let's revisit why the number is three.
First, you must recoup what it cost to acquire the customer (1x). Next, you must cover the operating costs of supporting that customer and delivering the service (another 1x). Finally, you must generate the reinvestment capital to grow the business and the returns owed to investors (one more 1x). That totals 3x.
The key here is factoring gross margin into the LTV calculation. The previous article introduced the simplified formula "LTV = monthly fee ÷ churn rate," but the more practical formula is:
LTV = ARPU × gross margin ÷ churn rate
Why include gross margin? Because not all revenue becomes profit. Server costs, payment fees, customer support, and for generative-AI products, inference costs — retaining even one customer has a cost of goods. Skip this deduction and you overstate LTV.
Let's look at a worked example, using data from a SaaS service.
| Metric | Value | Explanation |
|---|---|---|
| Monthly fee (ARPU) | ¥10,000 | Standard plan price |
| Gross margin | 80% | Revenue minus direct costs, as a ratio |
| Monthly churn rate | 2% | 2% of customers cancel each month |
| LTV | ¥400,000 | ¥10,000 × 80% ÷ 2% |
| Ad spend (monthly) | ¥5,000,000 | Total across ad channels |
| New customers (monthly) | 100 | New customers via advertising |
| CAC | ¥50,000 | ¥5,000,000 ÷ 100 |
| LTV/CAC ratio | 8.0 | ¥400,000 ÷ ¥50,000 |
In this example the LTV/CAC ratio is a very high 8x. This is an efficient business — one that should invest aggressively to accelerate growth. Without the gross-margin adjustment, LTV would appear to be ¥500,000, but the accurate, reality-based figure is ¥400,000. That gap feeds straight into the precision of your business decisions.
It is not unusual for early-stage startups to have LTV/CAC below 1x. That is not necessarily bad: while searching for product-market fit (PMF), learning should take priority over efficiency. What matters is improving LTV/CAC to 3x or better promptly once PMF is found.
There are multiple levers for improving LTV/CAC. To raise LTV: reduce churn, raise ARPU, grow upsells and cross-sells. To lower CAC: improve CVR, grow organic traffic, strengthen referral programs. Which lever works best depends on your situation, but improving churn is generally held to have the largest impact.
Chapter 6 Wrap-Up — For AI Products, Cost Visibility Is the Key
For generative-AI products, understanding your cost structure matters even more than in traditional SaaS. Inference costs, external API fees, log retention, audit compliance, and customer success load all hit gross margin and payback directly. Even at ¥10,000 of revenue per user per month, if a heavy user's API costs exceed ¥5,000 a month, gross margin falls below 50% and the payback period nearly doubles.
So it is not enough to watch user counts and ARR — from early on you must make visible "which customers are using which features at what cost." Usage caps per plan, metered pricing for heavy users, cost optimization through model selection: product design and pricing design must be thought through as one. Qualiteg supports AI-product cost visibility and pricing design as well.
Chapter 7: A Practical Approach to Improvement
— Data-Driven Optimization —
Pinpointing Improvements with Funnel Analysis
Funnel analysis visualizes each stage of the customer journey from awareness through purchase to ongoing use, identifying where people drop off. Like a funnel, the numbers shrink as the stages progress — that is what you analyze.
Consider a typical SaaS funnel. Say 10,000 people visit the website. Of those, 3% (300) sign up for free. Of the 300 who register, 30% (90) start a free trial. Of the 90 trial users, 20% (18) convert to a paid plan. And of the 18 who paid, 90% (16) are still subscribed a year later.
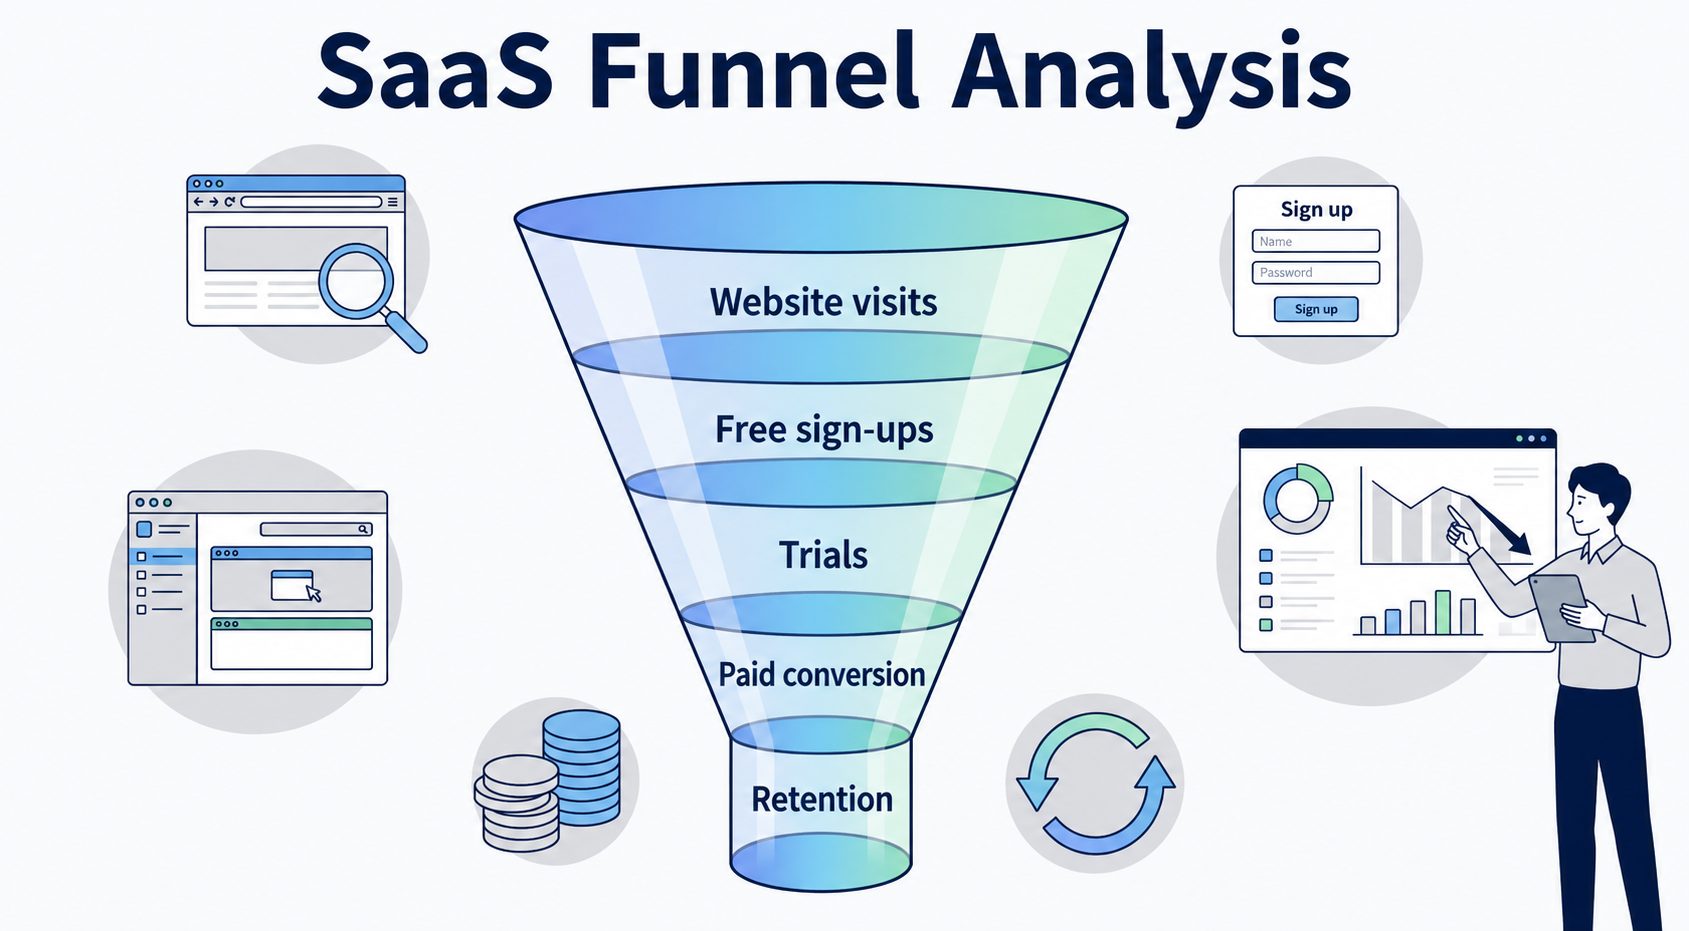
Looking at this funnel, the biggest bottleneck is the 30% conversion from free signup to free trial. Improving this stage grows paying customers most efficiently. Lift that conversion from 30% to 40%, and paying customers rise from 18 to 24 — a 33% increase.
Let's look at concrete funnel tactics. To raise the visit-to-signup conversion: cut fields from the registration form, add social login, and communicate the benefits of signing up clearly. Cases have been reported where cutting the form from 10 fields to 3 improved conversion substantially.
To raise signup-to-trial conversion, effective tactics include better onboarding emails, product tours, and proactive outreach from customer success. The first 24 hours after signup are decisive: if users do not experience value within that window, odds are high they never log in again.
To raise trial-to-paid conversion: monitor usage during the trial and give extra support to low-usage users, send reminders before the trial ends, and present limited-time offers.
Evaluating Customer Quality with Cohort Analysis
Cohort analysis tracks the behavior of customer groups acquired in the same period (cohorts) over time. It lets you measure changes in customer quality and the effect of your initiatives accurately.
For example, take a cohort of 100 customers acquired in January 2024. Suppose 90 remain in February (90%), 85 in March (85%), 82 in April (82%), 80 in May (80%), then the count stabilizes around 80. Meanwhile, a cohort of 100 acquired in April 2024 declines steadily: 85 in May (85%), 75 in June (75%), 68 in July (68%), 62 in August (62%).
The analysis shows the January cohort is high quality and the April cohort is low quality. You need to investigate why April's customers are weaker. Perhaps a large April campaign pulled in customers outside your target. Or perhaps a competitor launched a new service and you are losing the comparison.
Cohort analysis should also be done on a revenue basis. Even as customer counts shrink, revenue may be growing if the remaining customers upgrade. The ideal state is one where, even as some customers churn, upsells and cross-sells to the rest grow total revenue from the existing base. This is commonly called "negative churn."
Here are a few ways to turn cohort findings into improvements. First, analyze what characterizes your best cohorts and build a strategy to acquire such customers deliberately. If customers from a particular industry or company size retain especially well, concentrate marketing investment there.
Next, improving weak cohorts. You cannot change the nature of customers already acquired, but strengthening onboarding and customer success may improve their retention. Re-engagement campaigns targeted at a specific cohort are also effective.
Finally, understanding seasonality. Most businesses have some. Accounting software, for instance, tends to see higher retention among customers acquired around tax season (February–March). That insight supports a strategy of concentrating marketing spend in that window.
Continuous Improvement Through A/B Testing
A/B testing validates two (or more) versions simultaneously to establish scientifically which produces better results. In a subscription business, nearly everything is worth A/B testing: the website, emails, product features, pricing.
Price A/B tests are especially powerful. Suppose a service priced at ¥5,000 a month splits new prospects into two groups, showing group A ¥5,000 and group B ¥7,000. Conversion comes in at 20% for A and 18% for B. Group A looks better at first glance — but compute revenue: A yields ¥5,000 × 20% = ¥1,000, B yields ¥7,000 × 18% = ¥1,260. Group B generates 26% more revenue.
Note that price A/B tests require care around customer experience and fairness. In B2B especially, showing different prices to customers on equal footing can damage trust, so choose your test subjects carefully — plan structure, messaging angles, discount conditions. Design tests so customers never feel treated unfairly: landing-page messaging at the prospecting stage, or measuring the effect of staged price revisions over time.
Onboarding A/B tests are effective too. Testing whether the product tour is "skippable" versus "mandatory," for instance, can show that the mandatory version slightly raises short-term drop-off while substantially improving long-term retention — a case demonstrating the value of making sure users truly understand the product, even at some initial friction.
Email subject-line A/B tests are among the easiest and most effective plays. Test contrasting approaches: "Limited time! 30% off" vs. "A special offer just for you," or "New feature announcement" vs. "How to cut your work time by 50%." Even a few points of open-rate improvement flow through to click rates and conversions downstream.
A few cautions when A/B testing. First, ensure statistical reliability. The sample size you need depends on your current conversion rate and the improvement you want to detect. Judging from small samples risks mistaking random noise for a win. Test duration matters too: behavior can differ between weekends and weekdays, so running at least one to two weeks is the safe practice.
Chapter 7 Wrap-Up — Data-Driven Does Not Mean Staring at Numbers
Data-driven improvement is not staring at numbers. It is identifying which customers are failing to receive which value at which moment, and adjusting product, sales, customer success, and pricing in concert.
For AI products especially, expectation-setting and onboarding in the early days of adoption strongly influence later retention. Generative AI is not a panacea — it has strengths and weaknesses — and customers who start with the wrong expectations tend to conclude early that "it's not as useful as I thought" and leave. Catching early-churn patterns with funnel and cohort analysis, and carefully conveying the right expectations and use cases during onboarding, ends up making a major difference to LTV.
Building on lessons from our own services, Qualiteg supports metric design, data analysis, and customer success operations as one integrated effort, in parallel with the product improvement cycle. Standing up dashboards is not enough — we believe the goal is an organization that can derive the next move from the numbers and actually carry it through to execution.
Coming Up Next
In Part 4, we take a close look at the common failure patterns in subscription businesses and how to counter them: the freemium trap, complexity creep from over-adding features, neglecting downsells, and other pitfalls many companies fall into — with AI-product-specific angles woven in.
See you next time!