Building a Coding Agent from Scratch, Part 3: "It Didn't Stop" Is Not "It Made Progress." Count Idle Turns, and Cap the Thinking Without Cutting It
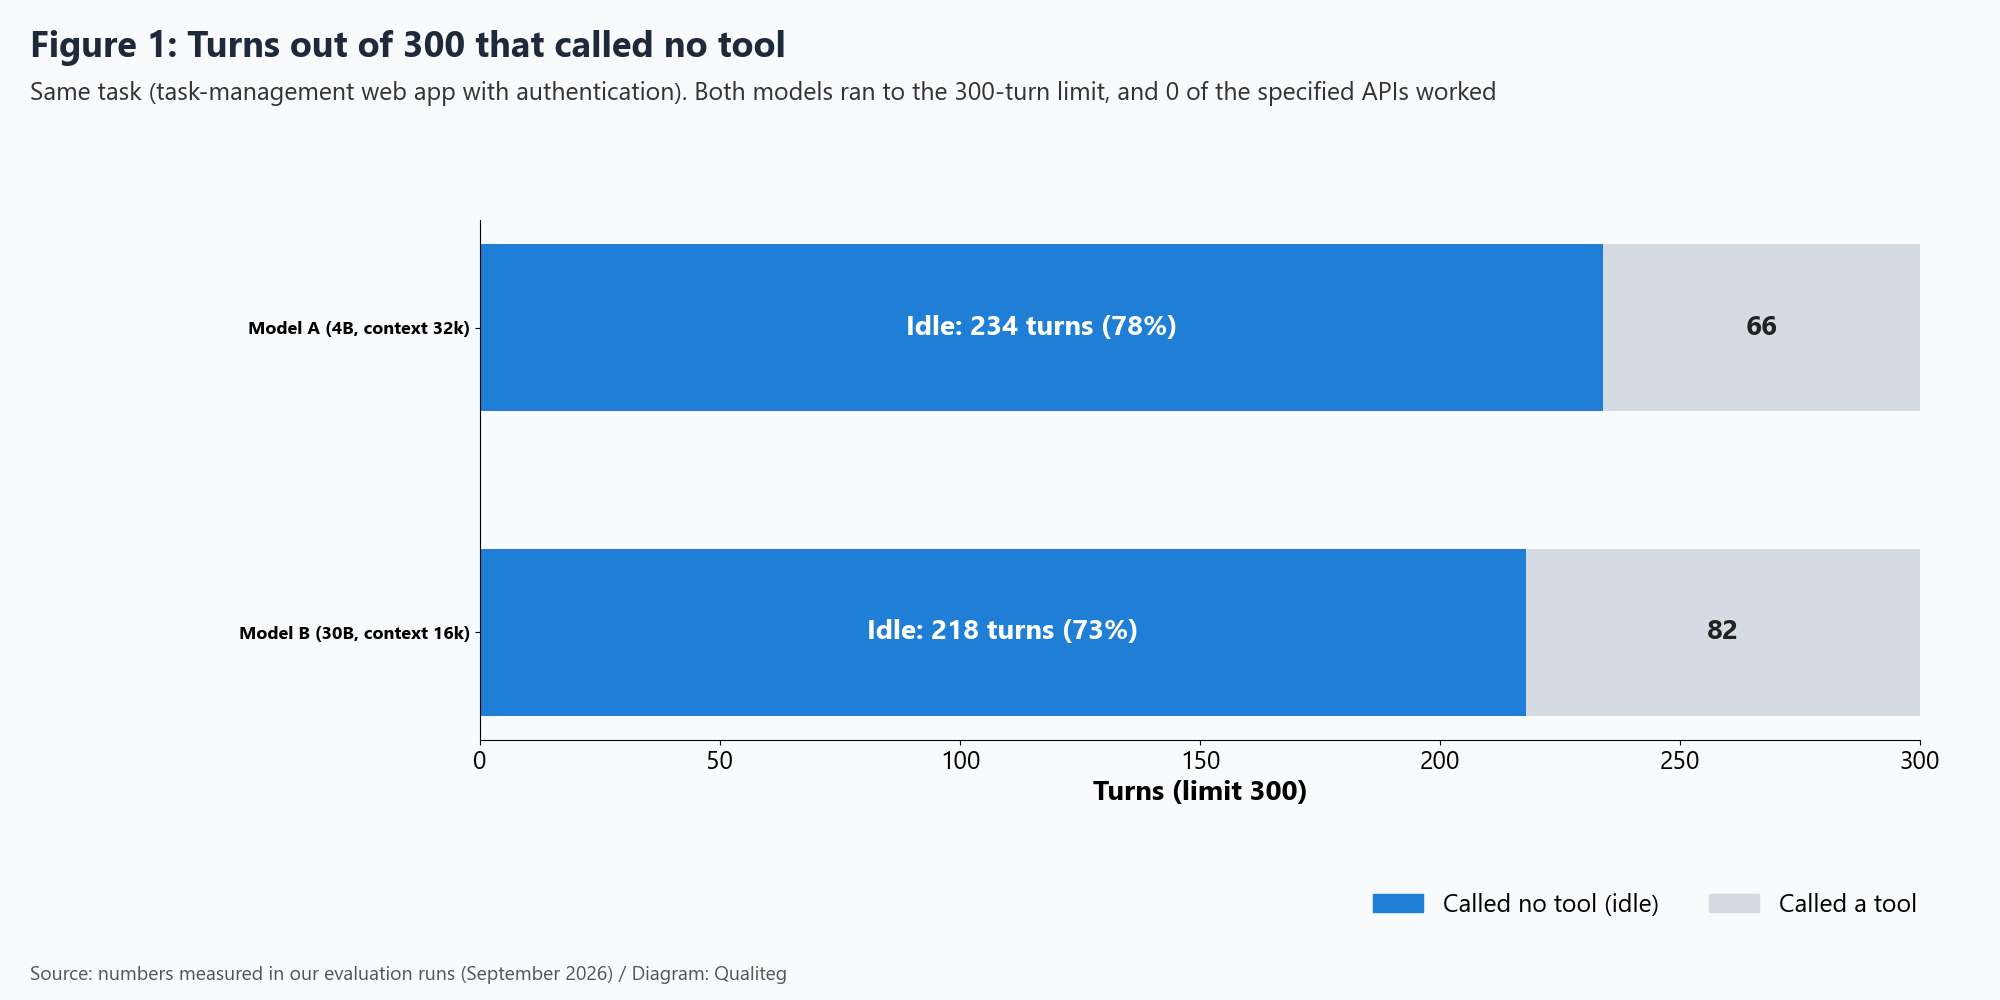
300 turns, zero APIs. Re-reading the log showed 234 turns had never called a tool. We cover the idle rate as a metric, idling that shifts form each time one is closed, how turning thinking off dropped 95 to 71 without saving time, and counting the other side after widening the output window.

Hello!
This is from the period when we had our own coding agent, running on a local LLM, build a web system with authentication.
It is a record of how we hardened our agent harness so that a small open model could carry the coding all the way through to the end (the goal we were aiming for).
We ran two models, both ran to the 300-turn limit, and the number of working APIs from the specification was zero.
At that point I wrote in my notes:
"From here on, this is a question of the model's implementation ability."
The next day, after re-aggregating the event log from a different angle, I retracted that conclusion.
Out of 300 turns, there were 234 turns (78%) in which the model never called a tool even once.
For the other model it was 218 turns (73%). It had not been running. It had merely been spinning, unable to stop.
To put the conclusion first,
when you measure a coding agent's autonomy, the turn count is not a metric.
"It didn't stop" and "it made progress" are entirely different things. What you should look at is "the share of turns that called no tool," a number we call the idle rate.
In this article we describe, with numbers, what came into view once we started counting idle turns, and how we came to keep reasoning on while only capping it.
This article is Part 3 of the series "Building a Coding Agent from Scratch."
Part 1 covered "separating the turn runner from the stop decider,"
and Part 2 covered "the completion gate."
This time: how to find runs that pass the gate and yet are "not making progress."
| Part | Theme |
|---|---|
| Part 1 | Why "finishing the job" is hard. Separating the turn runner from the stop decider |
| Part 2 | "Done" means "it runs," not "it's written." The completion gate and how to write a pushback |
| Part 3 (this post) | "It didn't stop" is not "it made progress." Count idle turns, and cap them without cutting the thinking |
| Part 4 | Autonomy rules are for when nobody is around. If a human is present, stop and ask |
| Part 5 | Making local LLMs first-class citizens. Getting two 16GB GPUs to build a web system |
| Part 6 | How to build the evaluation. Have it build something that runs, auto-grade it, and doubt the grader itself |
| Part 7 | Logging and regression. Everything is found in the event log. And building with zero dependencies |
1. Counting Idle Turns Showed a Different Cause for Each Model
Let me get into some detail here.
234 turns and 218 turns. The numbers look alike, but what was inside them was completely different.
The 218-turn case was context overflow.
Before sending, the harness detected and logged "sending this as-is will exceed the window," and then sent it anyway.
The comment said "last line of defense against eating a 400 due to estimation drift," but in practice it stopped nothing. The model returned a 400, one turn was lost, and compaction ran at the head of the next turn. Worse, there were cases where compaction did not resolve the overflow: the design excluded the most recent 30 entries from compaction, so when large tool outputs came in a row, those 30 alone exceeded the window. That is why it overflowed 218 times while compacting 73 times.
The 234-turn case was repetition of the same response.
At turn 64 the model stated "all requirements are satisfied and the tests pass," and after that exactly the same text kept coming back. As described in Part 1, because we had stopped sending pushbacks, the history only gained the same response, and no new information was added to push the model toward its next action. Since we were giving it nothing new, it was only natural that the same output kept coming back.
In both cases, looking only at the score table, all you see is "300 turns used, 0 APIs." Only by counting idle turns did two separate holes become visible.
From here, we set one rule.
Do not blame the model's ability for a low score on a run whose idle rate exceeds 30%.
There was a case where the 4-bit quantized version of a model collapsed into repeating the same words, "Let me create files are files as files are files...", and hit a 33% idle rate. It looks like insufficient ability, but the cause was the interaction between quantization and long outputs.
2. Close One Form of Idling, and It Moves to the Next
Once you start counting idle turns, you next start to see "in what form it is idling." And every time we closed one, another form appeared.
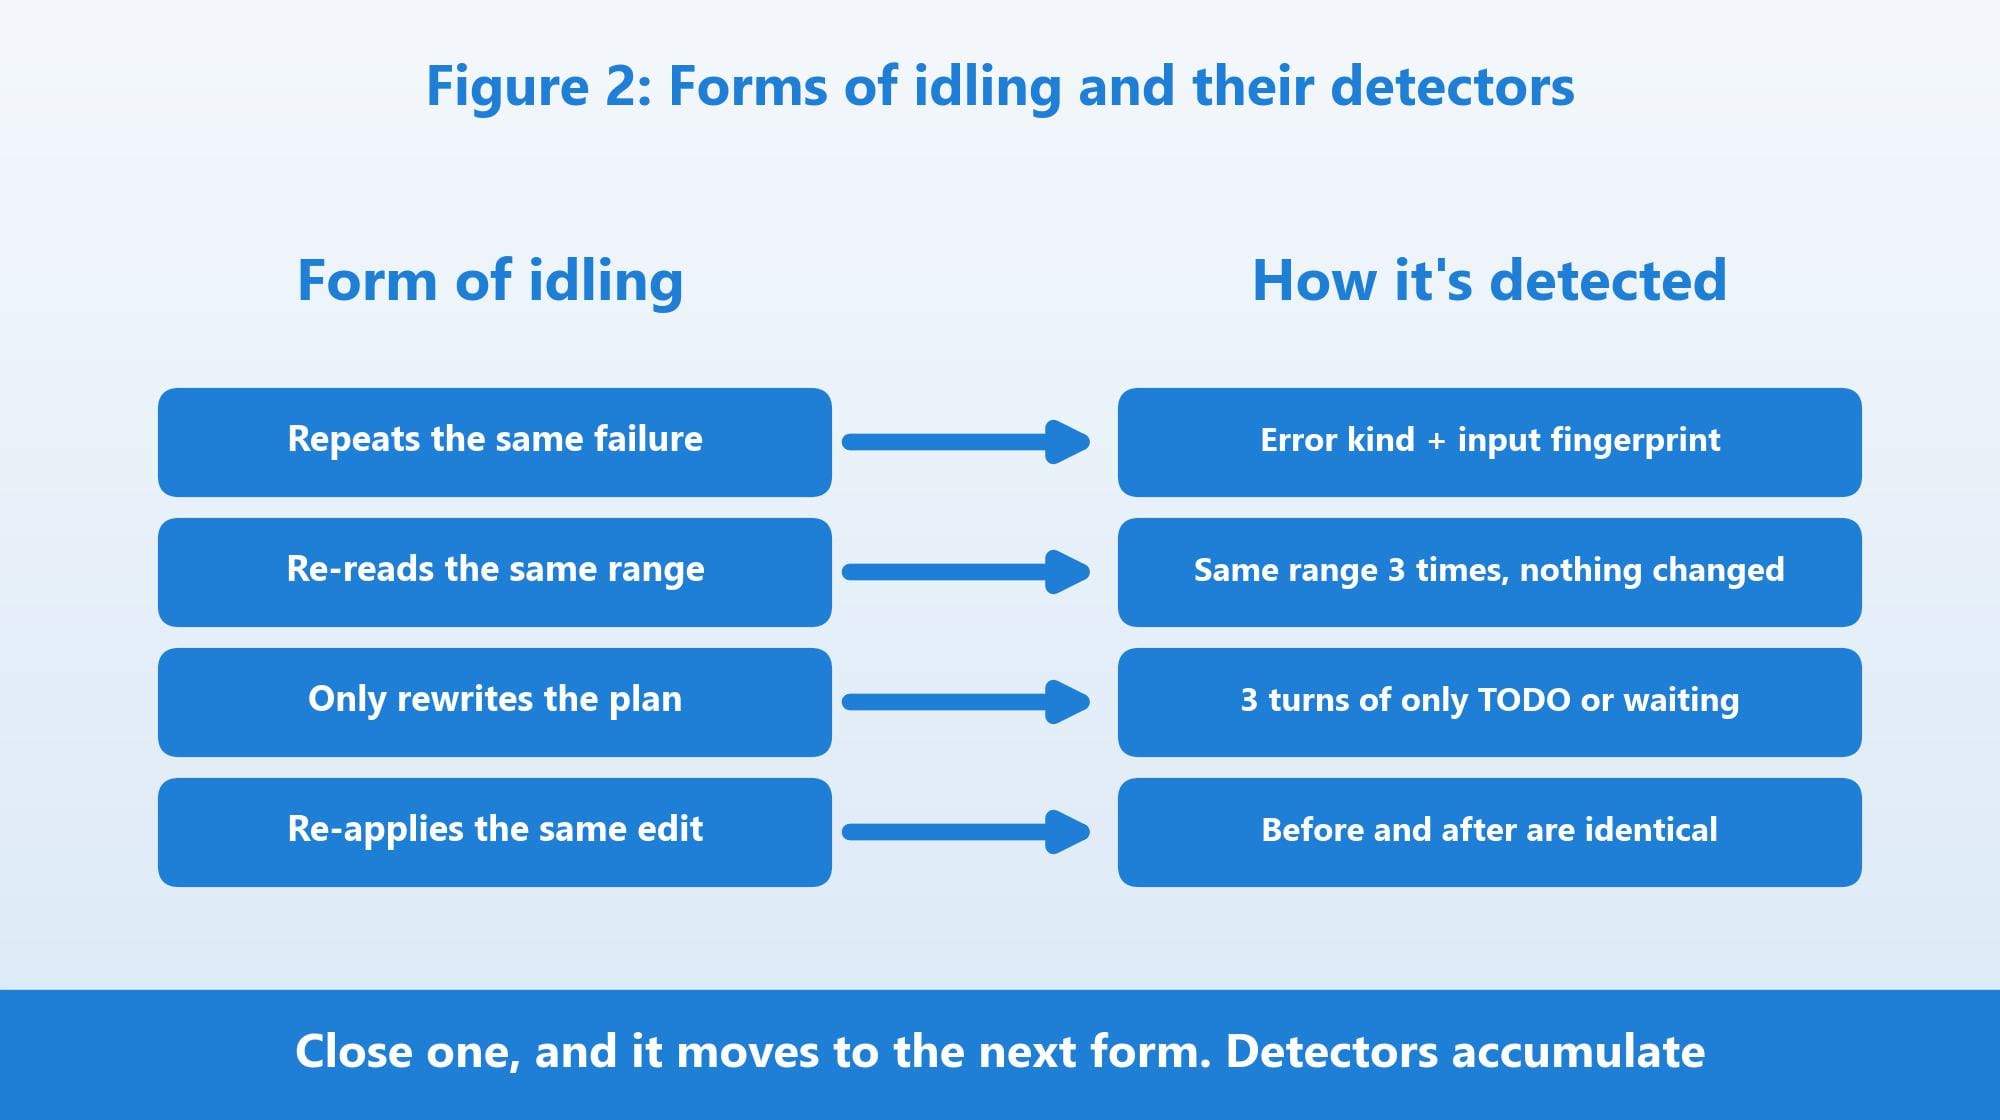
The biggest was re-reading. In one run, 65 to 77% of tool calls were file reads, and the same range of the same file was read 168 times.
The pattern was "read, syntax check, read, syntax check" with no edit in between. Since every read succeeds, it does not look like "repeating the same failure," and we had no metric that named what was happening.
Why does it cycle? When the result of reading the same range enters the context window again and again, the window fills with duplicates of the same content. Tokens run out sooner, compaction runs, and the old reads are dropped. Since they were dropped, it reads again.
Re-reading triggers compaction, and compaction triggers re-reading.
The fix: in the context passed to the model, keep the body of only the most recent read of a given range, and reduce the older ones to a single line saying "superseded by a later read." And push back if the same range is read three times without any change.
Once re-reading was closed, the next was TODO rewriting.
There were stretches where the same TODO was re-saved for 11 consecutive turns without a single line edited. We closed this too, with "push back if three consecutive turns consist only of TODO, waiting, or re-verification."
After that, re-applying edits that were already in place. The before and after of the replacement were identical, and the file already contained the replaced string. We changed it to return "that edit is already applied; re-read and move on."
One caution here. The judgment "it is repeating the same failure" has to look at whether it is the same including the contents of the error. If you count only "exit code is nonzero," things that are moving forward for a different reason also look like "the same failure," and the pushback gets in the way.
The mechanism that manages context was eating the context
There is one more lesson in the re-reading story. We fell into this hole three times.
The first was the case in Part 1 where 111 pushbacks piled up and ate the window. The second was the compaction summaries themselves piling up: 70 of them, about 30,500 characters, exceeding the window. The third is this duplication of reads.
All three times, a mechanism we built to manage the context was eating the context. The pattern of the fix is the same: leave the log untouched, and thin out only the context passed to the model. Do not keep pushbacks in the history. Consolidate summaries into one. Fold identical reads into one. Separate the record from what the model is shown. This pattern connects to the event-log discussion in Part 7.
3. What Varies Is the "Path," Not the "Result"
After eliminating the idling, running the same task three times on the same model gave this.
| Run | Turns | Wall time | Score |
|---|---|---|---|
| Run 1 | 121 | 73 min | 94.9 |
| Run 2 | 40 | 17 min | 93.8 |
| Run 3 | 144 | 87 min | 96.5 |
The turn counts vary by more than a factor of three. The scores stay within ±1.5 of the three-run average (95.1).
The same thing happened with another three runs after further harness fixes. Turns varied at 73, 263, and 134, and the scores were 99.2, 94.4, and 93.2. The 263-turn run was not idling; it kept fixing failures in the tests it had written itself, and the harness-side share of time was 4%.
What varies is the path, not the result.
Knowing this, our evaluation now includes
"run the same task three times, and check whether all three scores fall within ±5 of their average"
as a pass/fail metric. The spread of turn counts is not a metric. Looking at a single run and saying "this model is slow" or "fast" is only looking at the chance of the path.
4. Turning Off Thinking Dropped 95 Points to 71, and Saved No Time
Adjacent to the idling story is how to handle reasoning.
Our main local model is the type that emits thinking before its response, and it takes 25 to 36 seconds per turn. Assuming it would be faster with thinking off, we ran one run with thinking disabled.
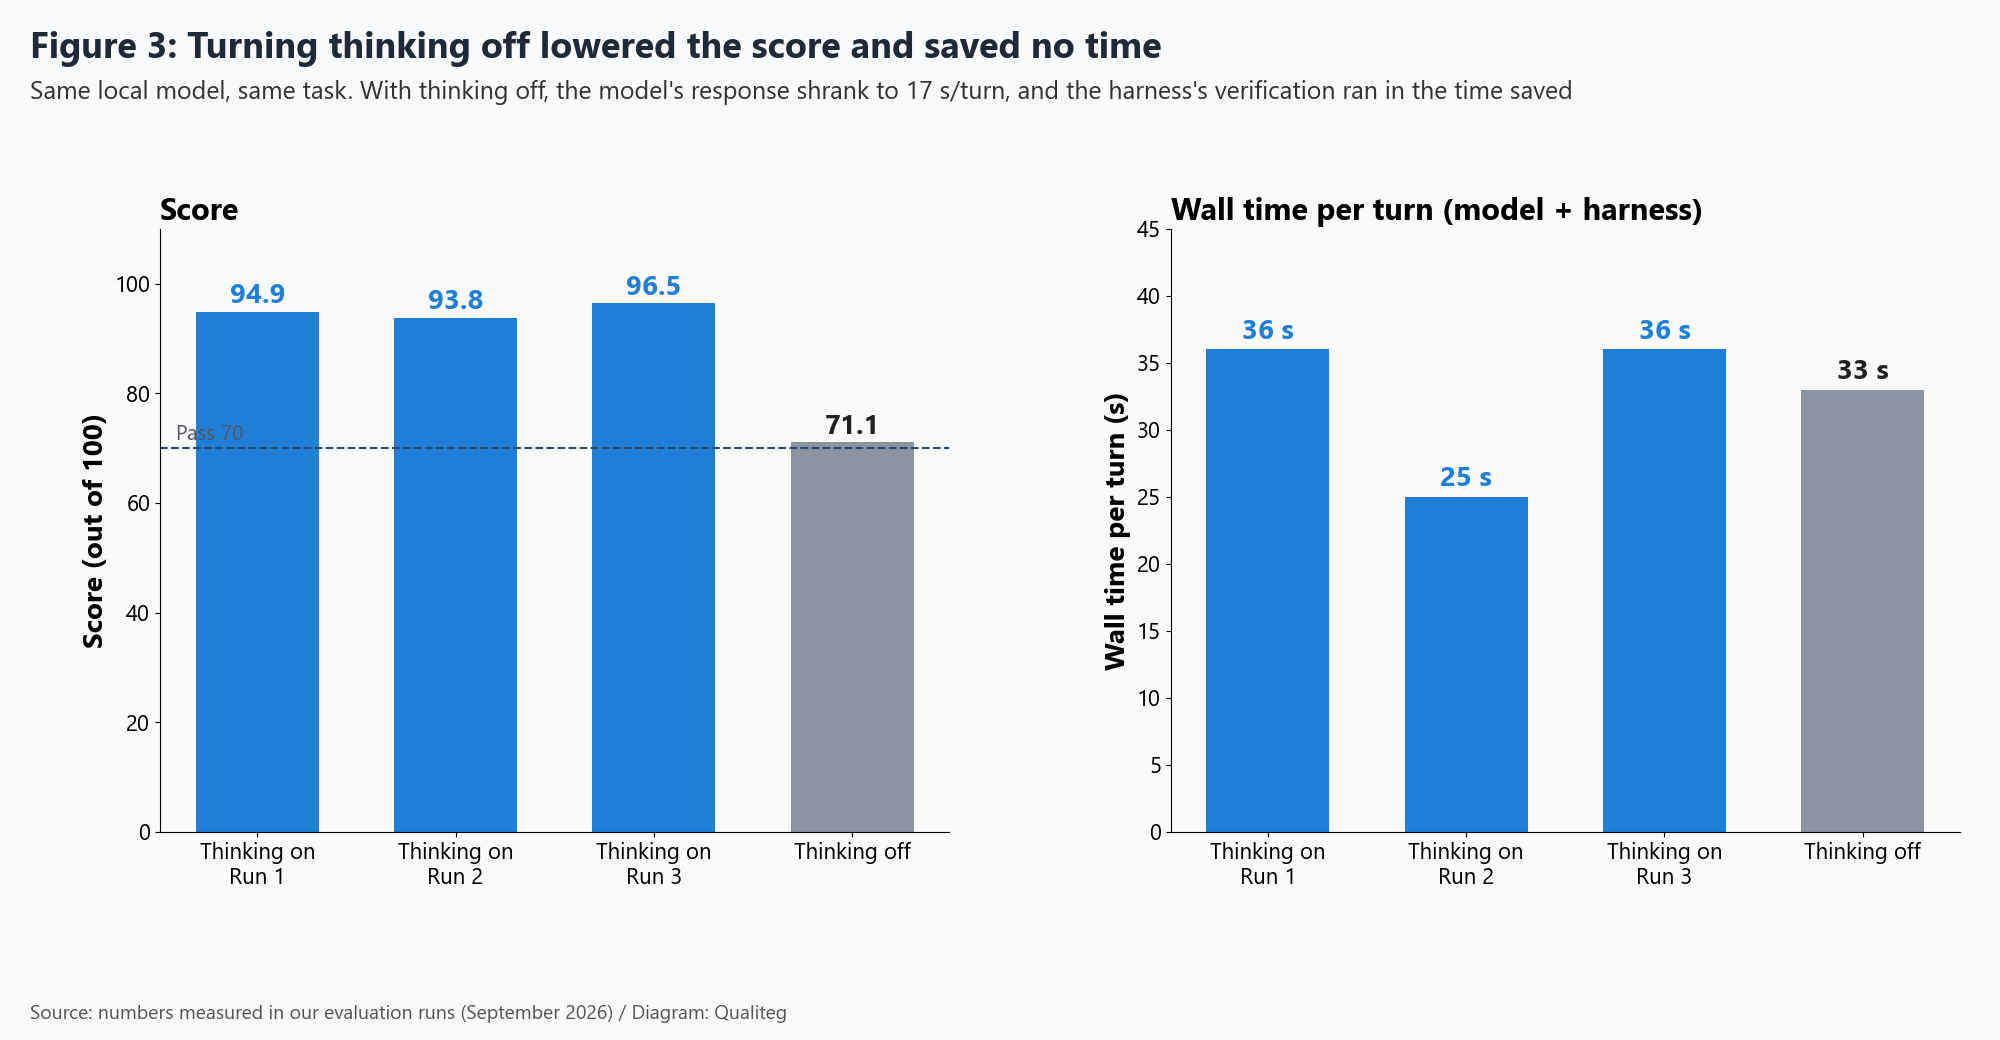
| Condition | Score | Turns | Wall time | Model response | Wall time per turn |
|---|---|---|---|---|---|
| Thinking on (3 runs) | 94.9 / 93.8 / 96.5 | 121 / 40 / 144 | 73 / 17 / 87 min | 25 to 36 s/turn | 25 to 36 s |
| Thinking off (1 run) | 71.1 | 63 | 34 min | 17 s/turn | 33 s |
The model's response shrank to 17 seconds per turn. However, wall time per turn was 33 seconds, no different from thinking on. Most of the difference was the harness's automated verification: tests ran 58 times in 63 turns, and 24 of those were after read-only or TODO-only turns. The time the model saved simply went into verification.
And the score fell from 95 to 71. It handled the specification's "API that returns JSON" and "page that accepts a form" in a single handler without separating them, and reported "done" while still returning 302. None of the three thinking-on runs made this mix-up.
Thinking was helping not with speed, but with reading the specification. The default remains thinking on, unchanged.
5. But Thinking Needs a Cap
After deciding not to cut thinking, the opposite hole appeared.
It was when we widened the output window from 8192 to 16384.
The reason for widening is described later, but as a result, four turns in a single run ran to 16384 tokens on thinking alone and were cut off.
About 7 minutes each. That run scored 66.2 and took 130 minutes. A cut-off turn cannot call a single tool, so it costs one extra pushback round trip.
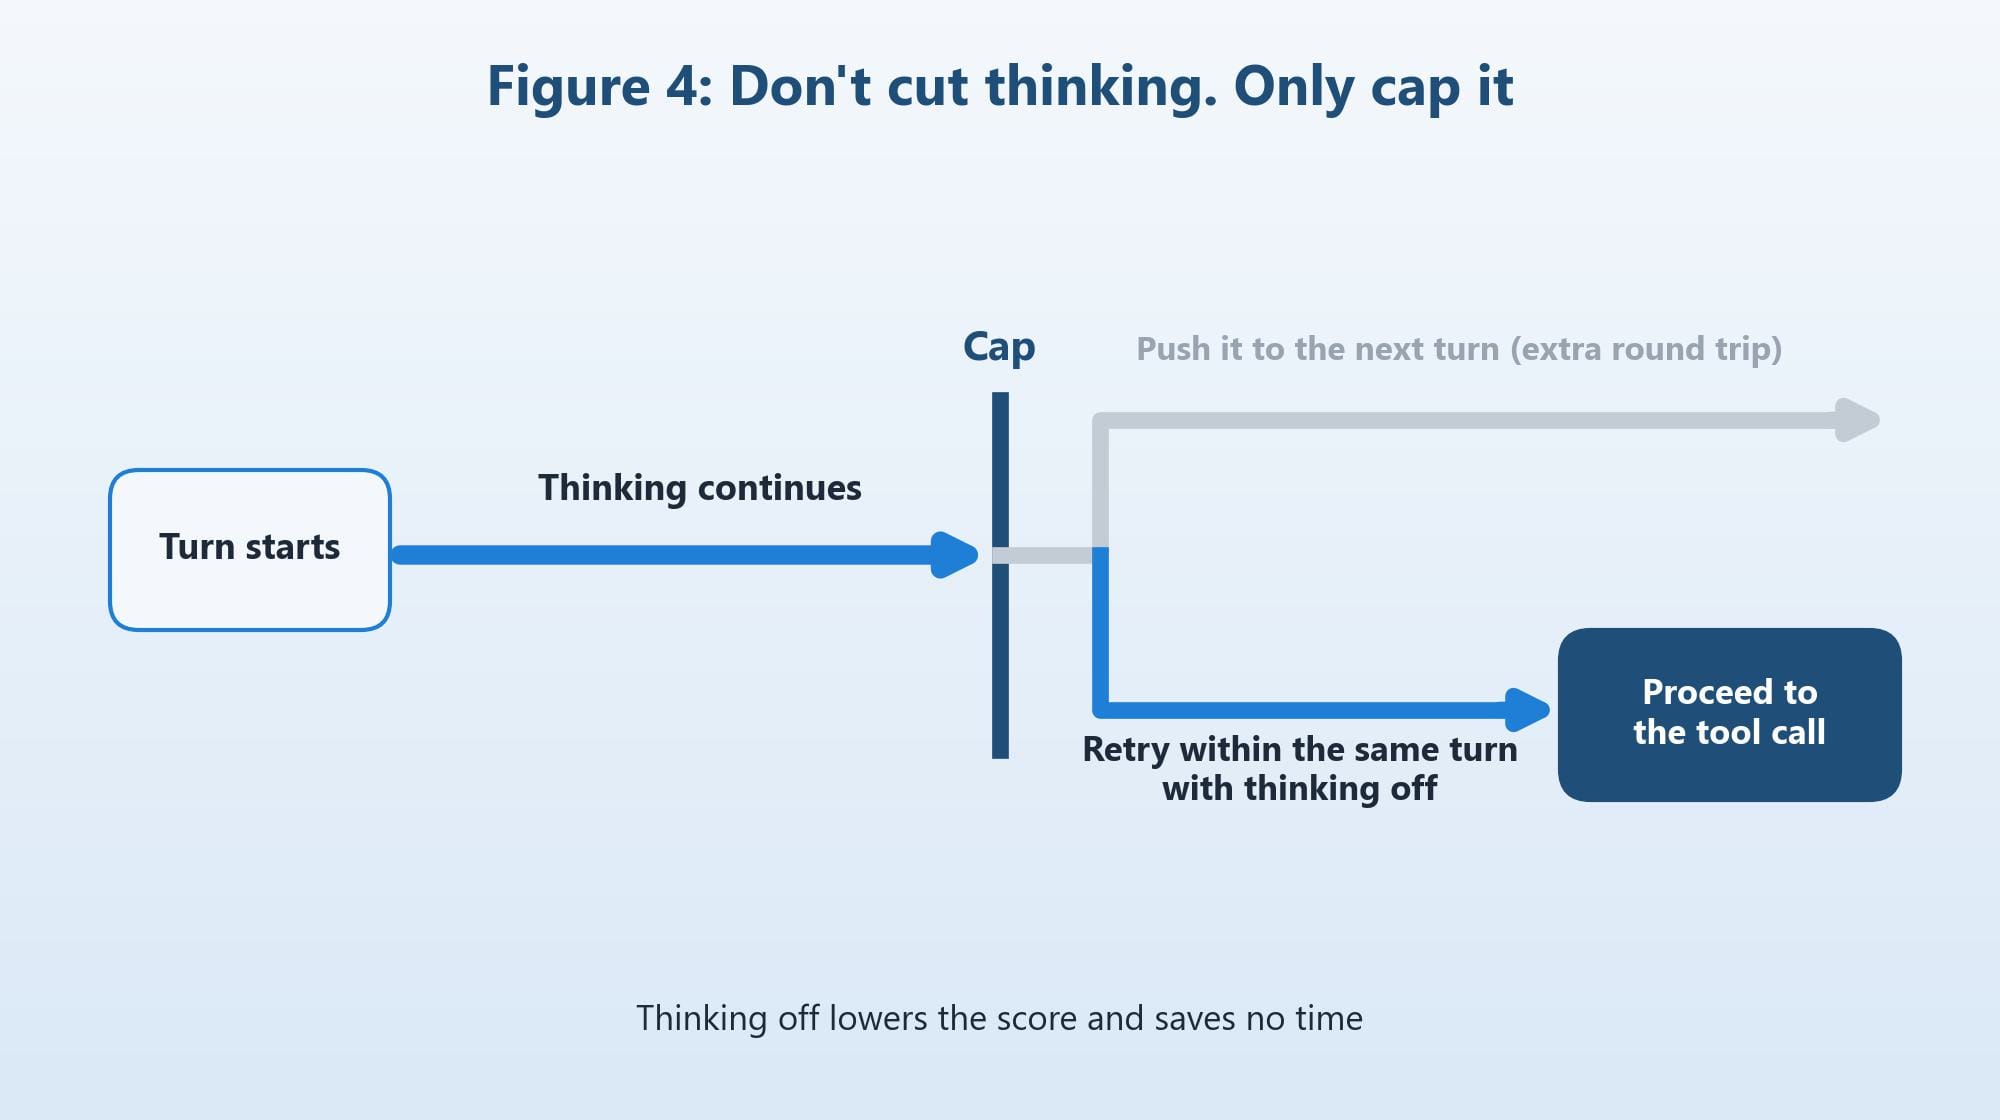
The fix: if thinking alone exceeds the equivalent of 8192 tokens and neither the body nor a tool call has begun, abort that stream and retry within the same turn with thinking off. The turn number does not advance. This makes two queries to the model, but in this series' turn counts it counts as one turn. The same task went back to 83.8 points and 31 minutes.
"Within the same turn" is the key. At first we implemented it as "turn off thinking on the next turn," but that uses two turns: the cut-off turn and the retry with a pushback attached. Retrying within the same turn takes one turn and needs no pushback.
6. Widen the Output Window, and Count the Other Side
The reason we widened the output window to 16384 was to allow a 39KB file to be written in one go. At 8192, a 27KB bulk write was cut off midway and had to be steered into splitting.
With the wider window, 39KB did indeed fit in one go. Two things happened in exchange.
One was the runaway thinking described above. The other was that compaction moved earlier, from the 60s to turn 27.
Tracing the cause: tool results (tool_result) were being thinned out as they aged, but nobody was thinning the tool call arguments (tool_use, that is, the bodies of the files written). The 39KB write stayed in the history, and the input grew by 8 to 10k tokens in a single turn. Dropping the body of writes older than the most recent 20 entries and larger than 1000 characters, passing only the shape "wrote this size to this file," settled it.
When you widen a window, always count the consumption on the other side (input and time). This lesson paid off elsewhere too. A context-overflow error is not "a provider outage" but "our input was too large," so instead of retrying, compact and resend. The same 400 gets different handling.
7. Until We Broke Down the Time, Everything Looked Like "the Model Is Slow"
Finally, one more story of the same kind as idling: the breakdown of wall time.
In one run, 45% of wall time was the harness's automated verification. The model was not slow; we were running tests too often. Only after producing the breakdown did the cause split into five. It ran even on turns with no changes. It ran on every write. It ran after read-only commands. It waited 120 seconds every time for a hung test. And it ran after commands that changed nothing.
The last one took time to find. Commands like "start the server" or "run the custom CLI" read, from their wording, as "could change something." But not a byte of source had changed. We stopped guessing from the wording, compared the source fingerprint (size and modification time) before and after the command, and ran verification only when something had actually changed. On a task with a background-process server, harness-side time fell from 19% to 4%.
An improvement whose numbers you cannot decompose becomes guesswork. For both the idle rate and the time breakdown, every time we added one more angle of aggregation, one more cause became visible.
Summary: Measure Progress, Not Turn Count
| Number to watch | How to read it |
|---|---|
| Idle rate (share of turns that called no tool) | Above 30%, suspect the harness. Don't blame the model for a low score |
| Share of reads, and the max read count of one range | 65 to 77% and 168 reads means a re-reading cycle |
| Consecutive turns of only TODO, waiting, or re-verification | Spinning on plan rewrites |
| Scores of three runs on the same task | If within ±5 of the average, the spread in turns is a matter of path |
| Breakdown of wall time (model / tools / verification) | If verification exceeds 20%, recount the triggers |
| Thinking | Don't cut it. At the cap, retry within the same turn with thinking off |
| Output window | After widening, watch the input-side growth and the turn at which compaction starts |
Next time: the flip side of this "don't stop" discipline.
The "don't stop" we trained in evaluation runs was also being applied in situations where a human could answer. Pushing back a model that asked about a vague instruction and making it build on its own; making it ask a declined confirmation seven times in different forms. We will describe the 19 cases that surfaced when we role-played six kinds of usage.
See you next time!